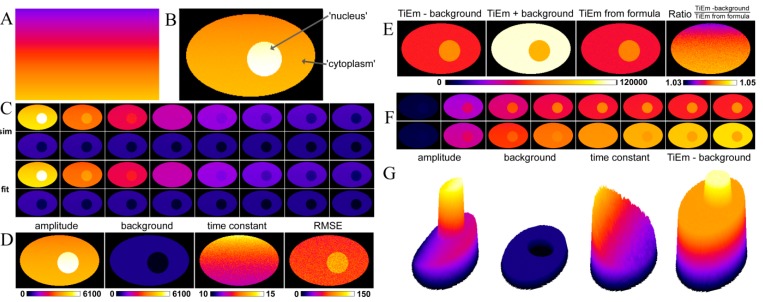
Figure 2.
Analysis of synthetic fluorescence images with illumination shading using PixBleach. Synthetic images were simulated using the Java-based Macro language of ImageJ, using the photobleaching model on a pixel-by-pixel, Equation (17), as described in the text. Spatially varying illumination intensity simulated by a ramp-like q-map (A) was used as input for the model at each pixel position with additional random variation of the intrinsic bleach rate constant, k2, according to Equation (18). The first frame of this simulation with M1 = 5000 and M2 = 7000 being constant throughout the cytoplasm and nuclear compartment, respectively, is shown in panel (B); (C) selected frames of the simulated bleach stack (C, upper two rows) and the reconstructed data from pixel-wise fitting of a mono-exponential decay to the synthetic image set (C, lower two rows); Panel (D) shows fitting results also with a FIRE LUT, from left to right (‘amplitude’, background’, ‘time constant’ and ‘RMSE’); (E) various forms of the time-integrated emission (TiEM); from left to right, calculated as summed pixel intensity in PixBleach, either without including background into the calculation (‘TiEm-background’) or with the estimated background included (‘TiEm + background’) and as product of the regression-derived amplitude and time constant (‘TiEm from formula’). The most right panel in E show the ration of ‘TiEm-background’ and ‘TiEm from formula’ in the indicated range (1.03 in dark blue to 1.05 in yellow/white). G, surface plots of the indicated parameter maps. See text for further explanations.

