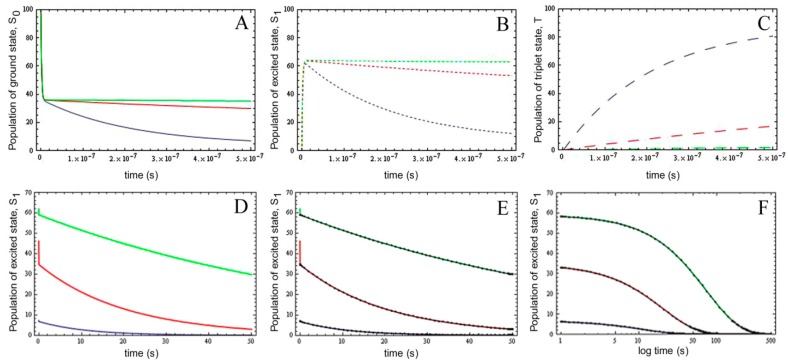
Figure 4.
Validation of the extended photobleaching model in the presence of varying triplet yield. The complete kinetic model shown in Equation (19) was solved numerically using a Runge-Kutta scheme implemented in Mathematica 7.0 (Wolfram research Inc., Champaign, IL, USA). (A–C) occupation of the singlet ground state, S0 (A, straight lines), the singlet excited state, S1 (B, short dashed lines) and the first triplet state, T (C, long dashed lines) for different intersystem crossing rate constants ranging from k3 = 6.6 × 10³ s−1 (green lines), over k3 = 6.6 × 10⁴ s−1 (red lines) to k3 = 6.6 × 10⁵ s−1 (blue lines) on the short time scale (i.e., ns–μs). D-F, dynamics of the excited singlet state on the long time scale for the same conditions; In (D), the decay from the excited singlet state according to the full numerical solution is shown. The analytical approximate solution based on the REA (Equation (35) closely matches the long-term dynamics of S1; (E, black lines and symbols show the analytical solution on top of the numerical simulation (colored curves)); Panel (F) is like (E) but with a logarithmic time axis to show the coincidence of numerical and analytical model up to 500 s.

