Figure 4.
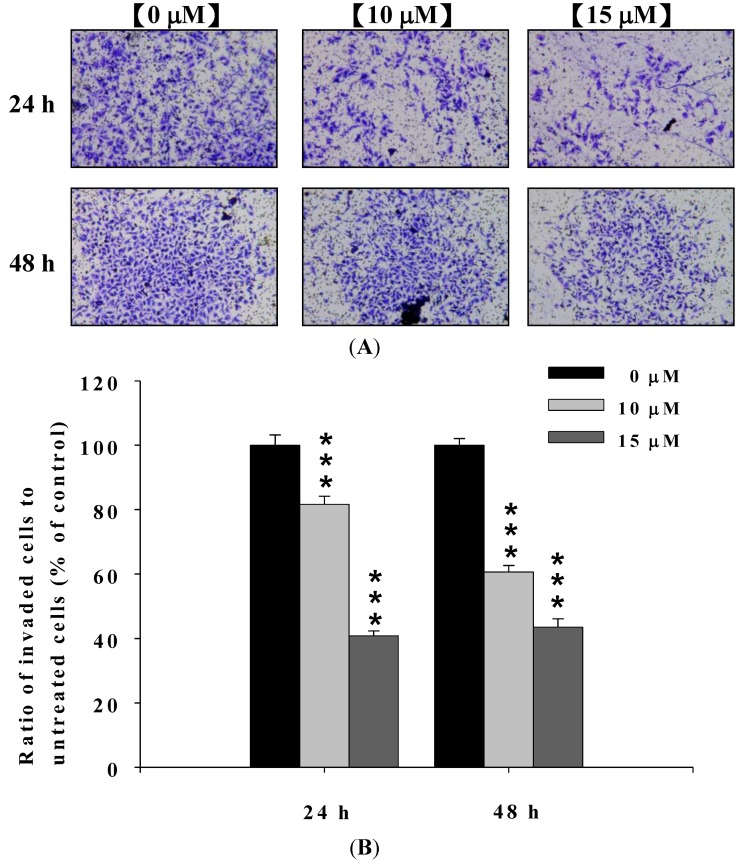
Deguelin suppressed the invasion of U-2 OS cells in vitro. U-2 OS cells (5 × 10⁴ cells/well) were incubated with 0, 10 and 15 μM of deguelin then penetrated through with the matrigel to the lower surface of the filter were stained with crystal violet and were photographed under a light microscope at 200×. Quantification of cells in the lower chambers was performed by counting cells at 200×. *** p < 0.001, significant difference between deguelin-treated groups and untreated-groups as analyzed by Student’s t test. Cells were stained with crystal violet and then were examined and photographed under a light microscope at 200× (A); The quantification of cells from each treatment in the lower chambers was counted at 200× (B).

