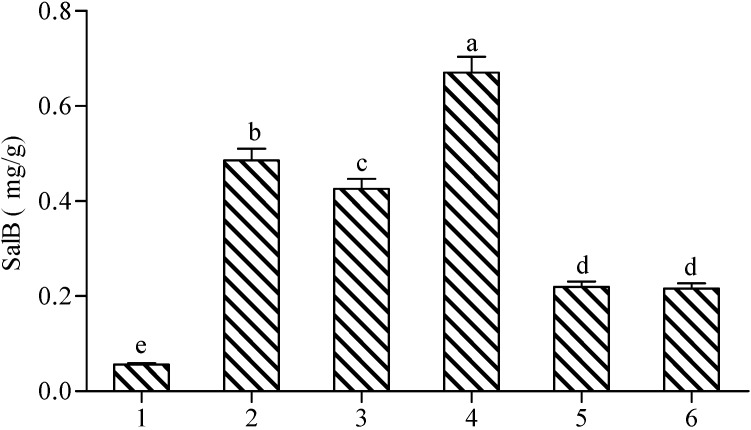
Figure 5.
Effects of different treatments on the production of Sal B in Salvia miltiorrhiza cell cultures. 1: control (H2O); 2: SA; 3: SNP + H2O2; 4: SNP + H2O2 + SA; 5: SNP + H2O2 + DMYU + IMD; 6: H2O2 + SNP + cPTIO + L-NNA. The detection time for determining Sal B production was the same as Figure 1. Different lowercase letters represented significance at 0.05.

