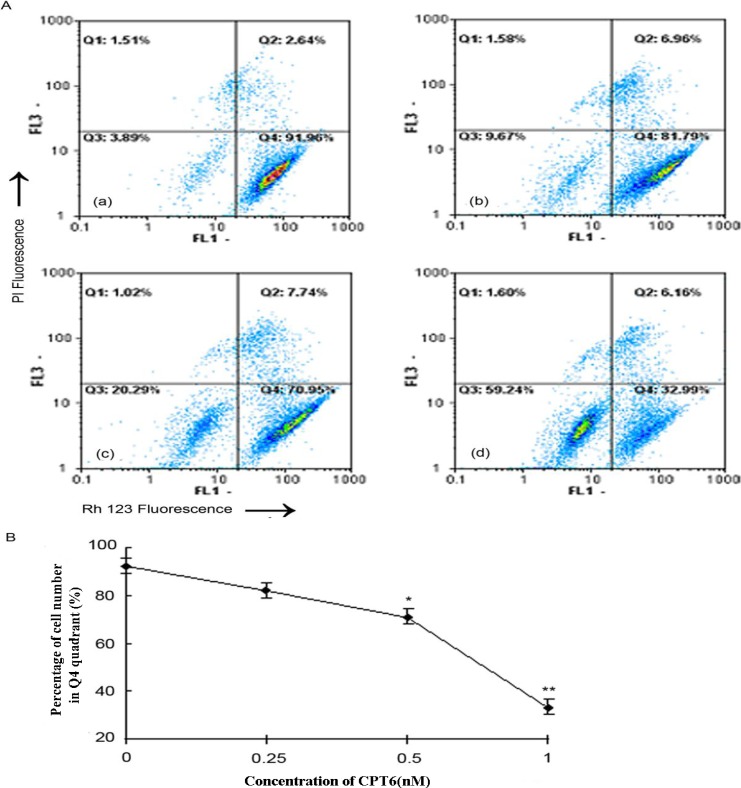
Figure 7.
Flow cytometric analysis of the changes in the mitochondrial membrane potential (ΔΨ m) in MCF-7 cells treated with CPT6 for 48 h. A: (a) Control group; (b) treatment with 0.25 nM CPT6; (c) treatment with 0.5 nM CPT6; (d) treatment with 1 nM CPT6. B: Reduction in ΔΨ m in MCF-7 cells treated with CPT6. The data was obtained according to the percentage of cell number in Q4 quadrant which elicited strong fluorescence, resulting from three independent experiments (* p < 0.05, ** p < 0.01); p value compared with the control group (0 nM CPT6).

