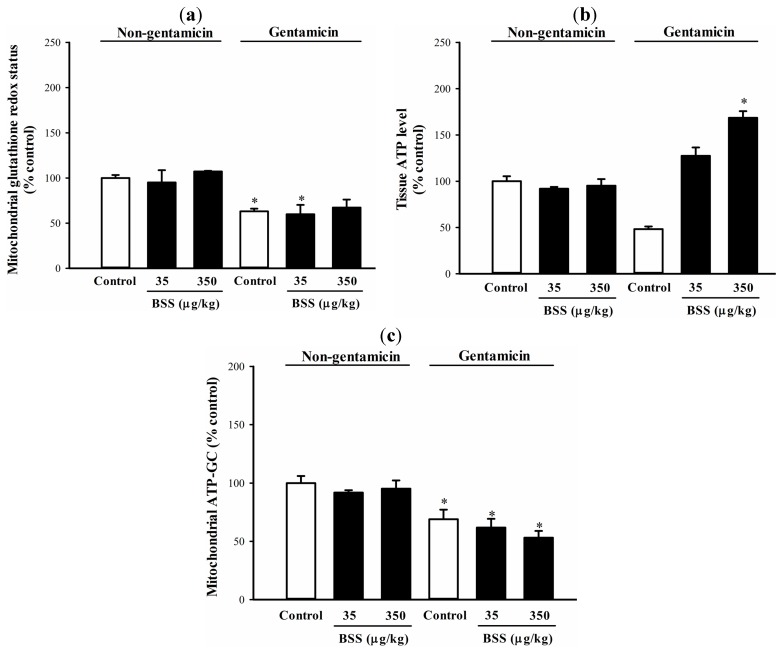
Figure 4.
Effects of BSS on control and gentamicin-challenged rat kidneys. (a) Mitochondrial glutathione redox status, (b) tissue ATP level and (c) mitochondrial ATP-GC were examined as described in Materials and methods. Data were expressed in percent control with respect to non-gentamicin control (mitochondrial GSH/GSSG ratio = 13.9 ± 1.6; tissue ATP level = 0.9 ± 0.1 nmol/mg protein; ATP-GC value = 997.8 ± 14.4 AU). Values given are means ± SEM, with n = 7.
* Significantly different from the non-gentamicin control; # significantly different from the gentamicin control (p < 0.05).

