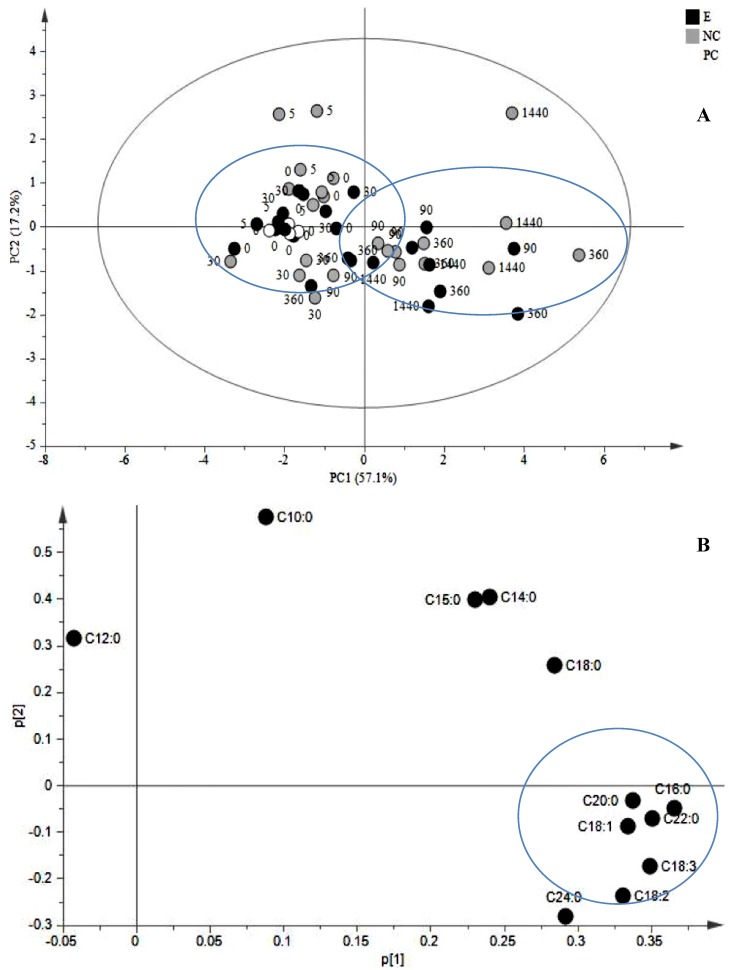
Figure 1.
Multivariate data analysis of cell suspensions of C. roseus treated with JA. (A) PCA scores plot generated from PCA using GC-MS normalized data (PC1 vs. PC2) of treated cells and controls. The variances accounted by PC1 and PC2 were 57.1% and 17.2%, respectively. (B) PCA loading plot from PCA (PC1 vs. PC2) showing the most influential FA. Black circles: JA-treated cells; white circles: untreated cells; grey circles: mock (40% EtOH).

