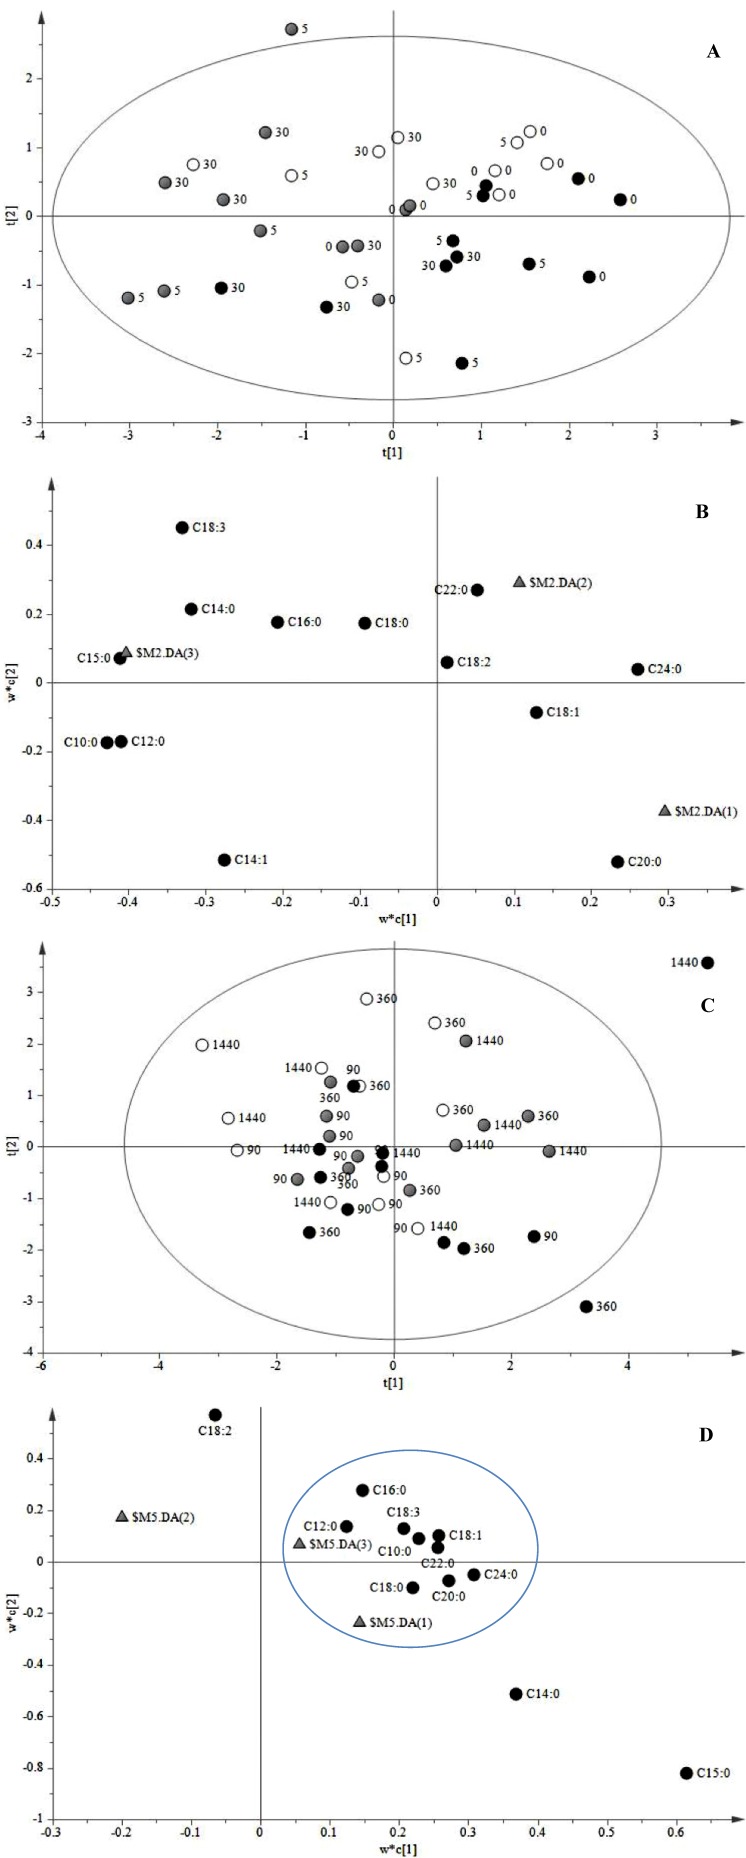
Figure 2.
PLS-DA of cell suspension cultures of C. roseus treated with JA. (A) Scores plot of FA forming the first class (0–5–30 min after induction). (B) Loadings plot of the first class (0–5–30 min after induction. (C) Scores plot of FA forming the second class (90–360–1440 min after induction). (D) Loadings plot of the second class (90–360–1440 min after induction). Black circles: JA-treated cells; white circles: untreated cells; grey circles: mock (40% EtOH).

