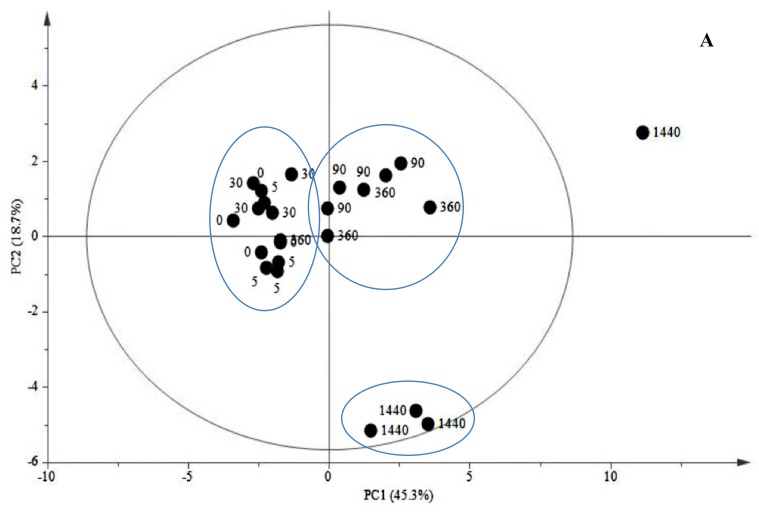
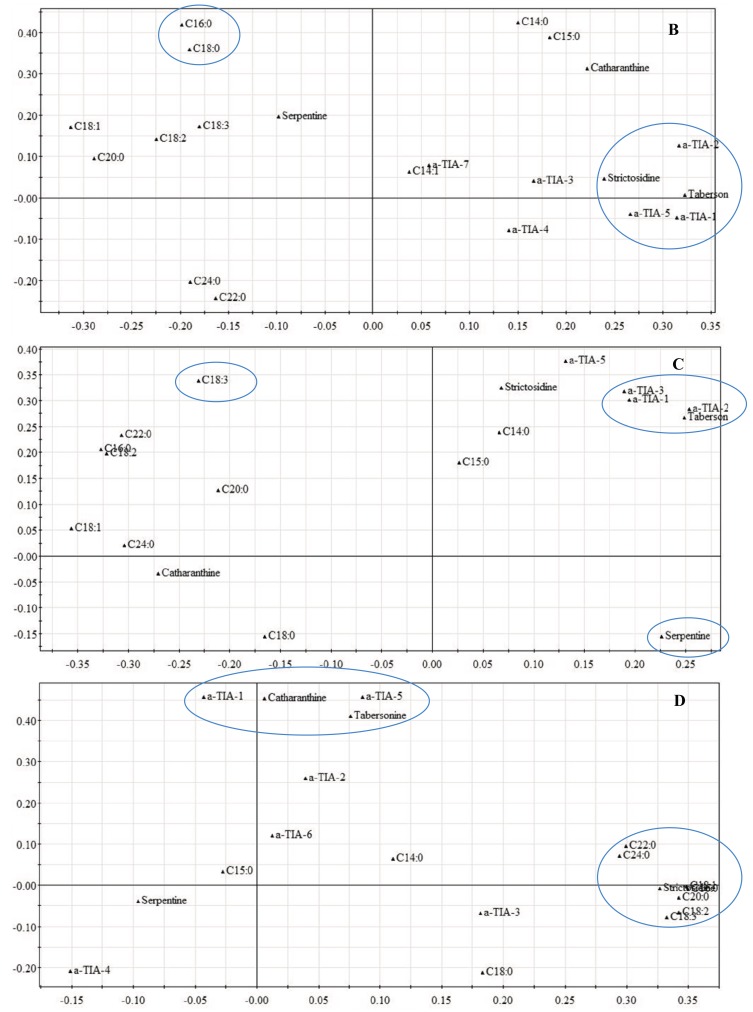
Figure 4.
PCA analysis of scores and loadings plots of FA and TIA in cell suspensions of C. roseus after JA treatment. (A) PCA scores plot of FA and TIA profiles allowed the separation of data into three different clusters of events: first cluster (0–5–30 min after JA treatment); second cluster (90–360 min after JA treatment) and third cluster (1440 min after JA treatment). Variances accounted by PC1 and PC2 were 45.3% and 18.7%, respectively. (B) PCA loadings plot of PC1 vs. PC2 of FA and TIA profiles in the first cluster. (C) PCA loadings plot of the second cluster. (D) PCA loadings plot of the third cluster.


