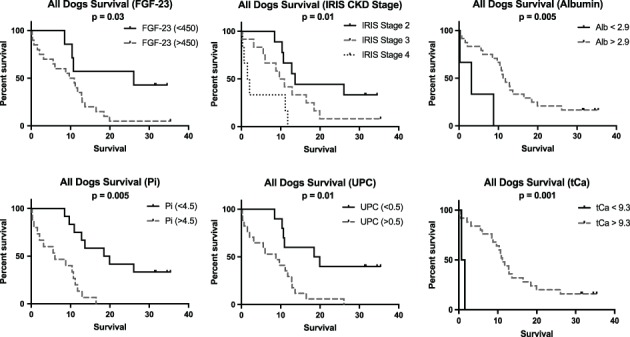
Figure 1.

Kaplan‐Meier survival curves based on increased fibroblast growth factor concentration, advancing International Renal Interest Society chronic kidney disease stage, hypoalbuminemia, increased phosphorus, proteinuria, and increased total calcium
