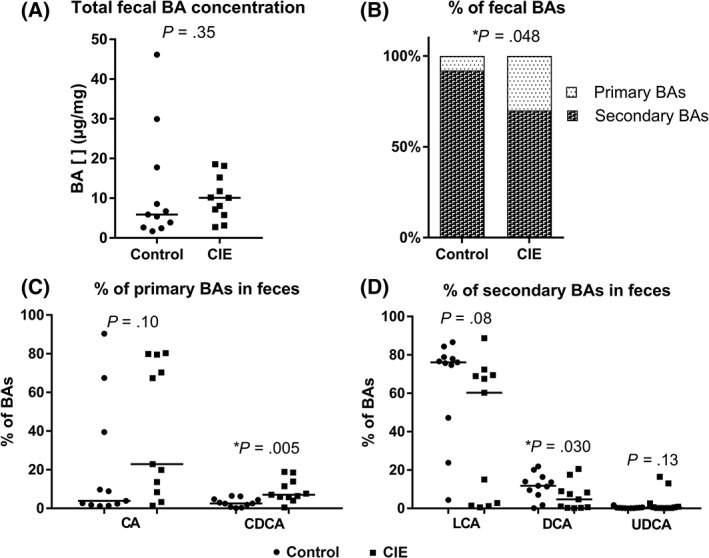
Figure 4.

Composition of the bile acid (BA) pool in the feces of control dogs (circles) and dogs with CIE (squares). (A) The total fecal BA concentration is similar between the 2 groups (P = .35). (B) The percentage of primary BAs is significantly higher in dogs with CIE (P = .04) than in control dogs. (C) The percentage of chenodeoxycholic acid (CDCA) is significantly higher in CIE dogs (P = .005) than in control dogs. (D) The percentage of litocholic acid (LCA), deoxycholic acid (DCA) is significantly lower CIE dogs (P = .03) than in control dogs. All results are expressed as the median. [], concentration; ns, non‐significant; CA, cholic acid; LCA, litocholic acid; UDCA, ursodeoxycholic acid. *Significantly different
