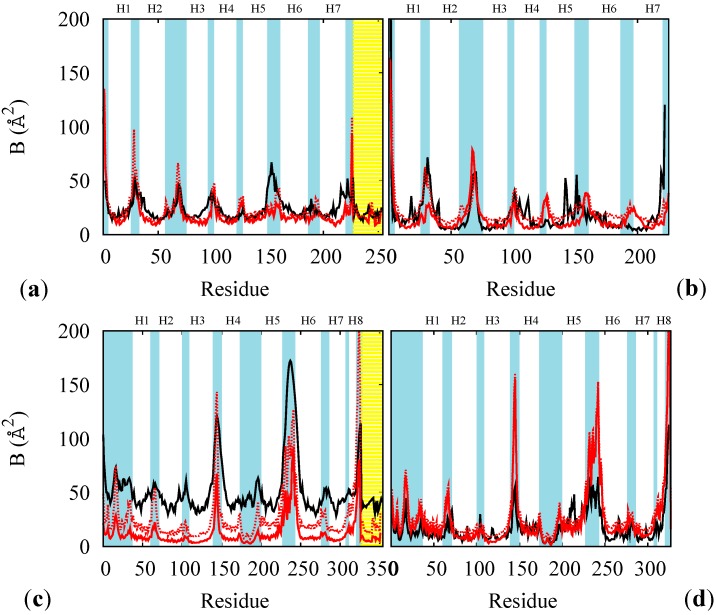
Figure 3.
B factors of the rest states of BR (a,b), and of MR (c,d), at 100 K for the whole proteins (a,c) and at 300 K for opsin only (b,d). Red lines: results from multi-scale simulations with (solid) and without (dotted) containing potential for the membrane. Black lines: experimental data at 100 K ((a) PDB code 1M0K and (c) PDB code 1U19) or from atomistic thermalized simulations of hydrated opsin at 300 K (of BR (b) and of MR (d)). The yellow shade indicates the retinal and the cyan shades the loops regions. The helices are labeled as Hn.

