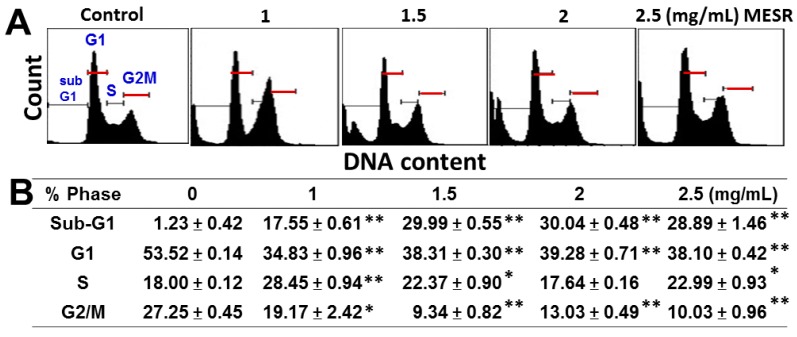
Figure 2.
Changes of the cell cycle distribution of MESR-incubated oral cancer Ca9-22 cells. Cells were incubated with MESR (0–2.5 mg/mL) for 24 h for flow cytometry analysis. (A) Typical cell cycle patterns of MESR-incubated Ca9-22 cells. (B) Statistics of cell cycle phases (%) for Figure 2A. Data, means ± SDs (n = 3). * p < 0.05; ** p < 0.001 against control.

