
Figure 5.
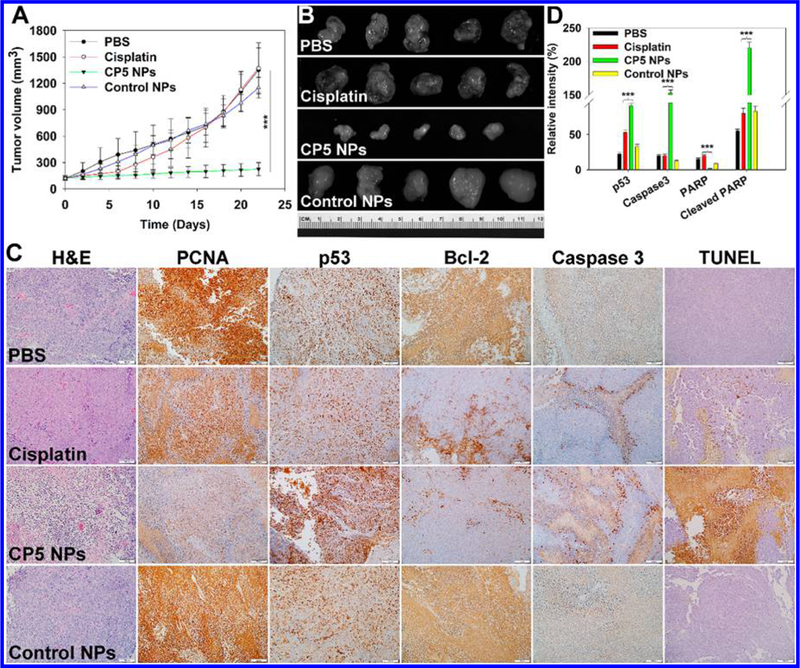
(A) Tumor volumes of A2780cis tumor-bearing athymic nude mice during chemotherapy (n = 5). CP5 NPs showed statistically significant growth suppression compared to cisplatin. (B) Harvested tumors after systemic treatment captured using the Maestro 2 in vivo imaging system. (C) H&E, IHC, and TUNEL images for tumors after treatment with PBS, cisplatin, CP5 NPs, or control NPs. (D) Western blot quantification of p53, Caspase 3, PARP, and cleaved PARP for tumors after treatment with PBS, cisplatin, CP5 NPs, or control NPs (three asterisks indicate p < 0.001 compared with cisplatin).