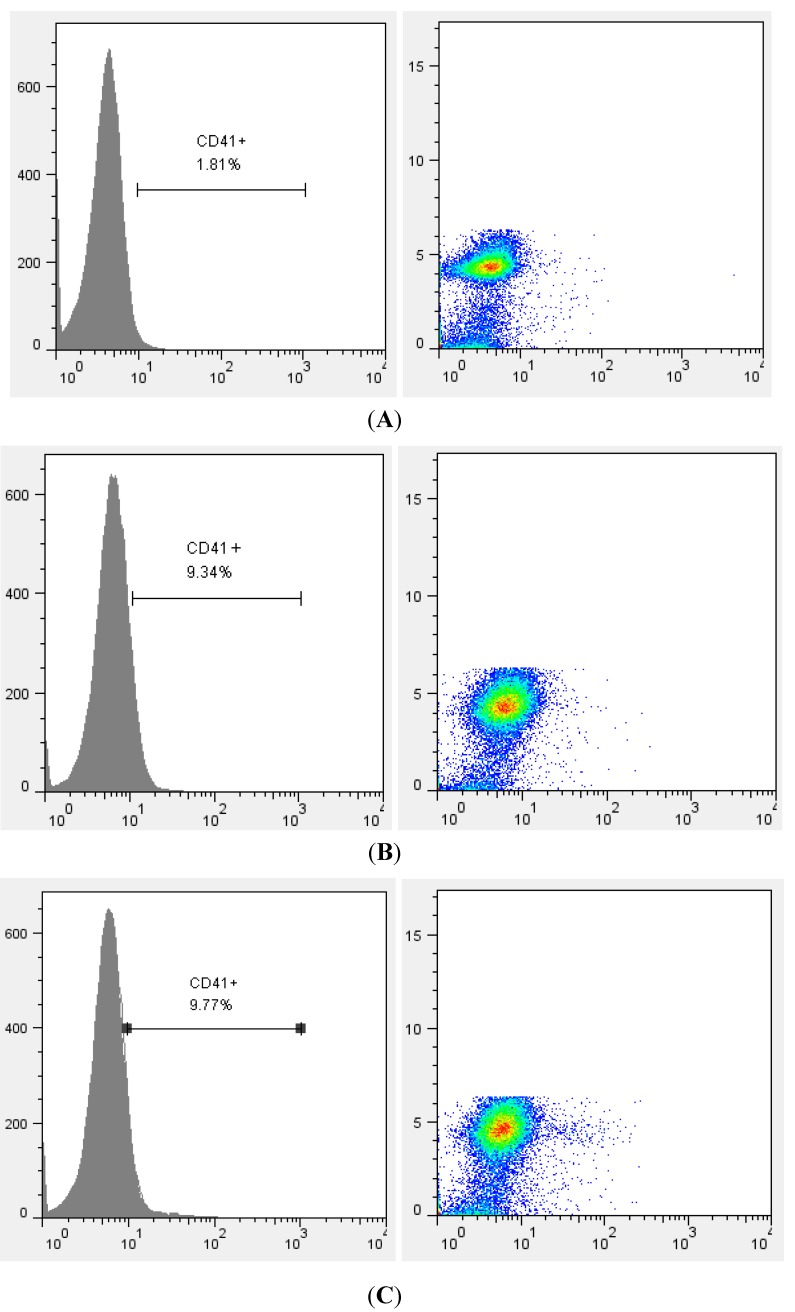
Figure 5.
Flow cytometric analysis of HEL cells stained with anti-CD41-PE. Histogram plot (left panel) and dot plot (right panel) show the percentage of CD41+ cells. Data represent one experiment of two independent experiments. (A) Control (DMSO); (B) Compound 1 (20 μg/mL); (C) Compound 2 (20 μg/mL).

