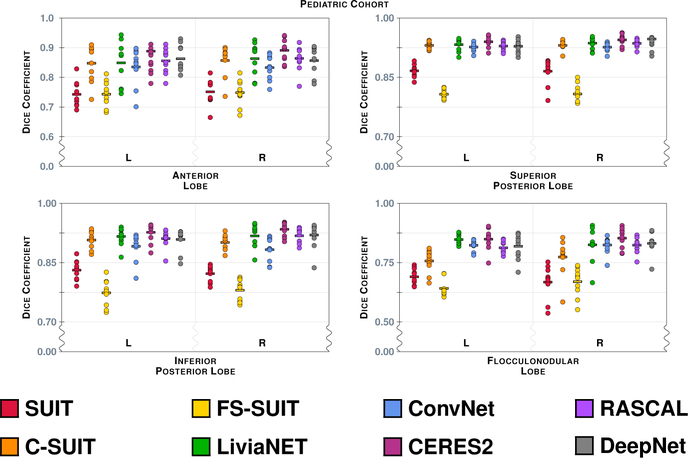
Figure 11:
The Dice overlap for the eight labels associated with the Lobe hierarchy are shown for the Pediatric Cohort, see Table 4 for the list of lobe labels. See Fig. 10 for instructions on interpreting the plots. We note that the scale has been zoomed to help appreciate the differences between the algorithms.

