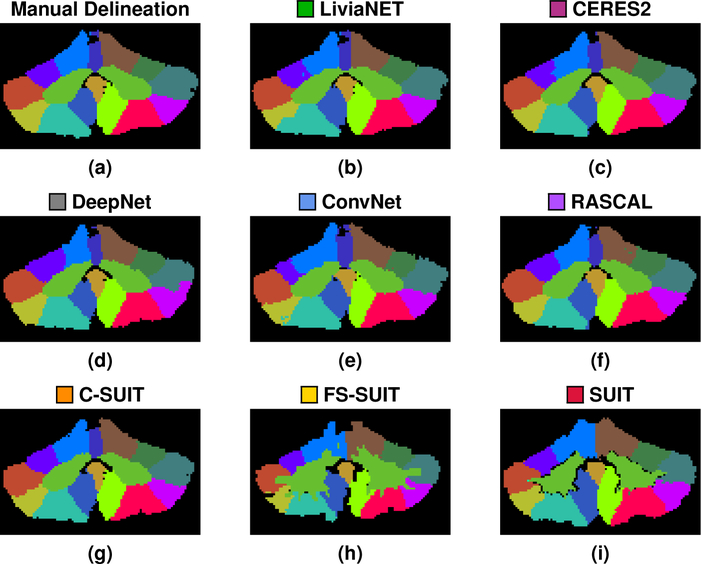
Figure 9:
Shown for a test data set in the Pediatric Cohort are the (a) manual delineation, and the results for each of the methods: (b)
 LiviaNET; (c)
 CERES2; (d)
 DeepNet; (e)
 ConvNet; (f)
 RASCAL; (g)
 C-SUIT; (h)
 FS-SUIT; and (i)
 SUIT, for the same coronal slice shown in Fig. 3. The methods are ranked based on their mean whole cerebellum parcellation (see Fig. 10 for details).

