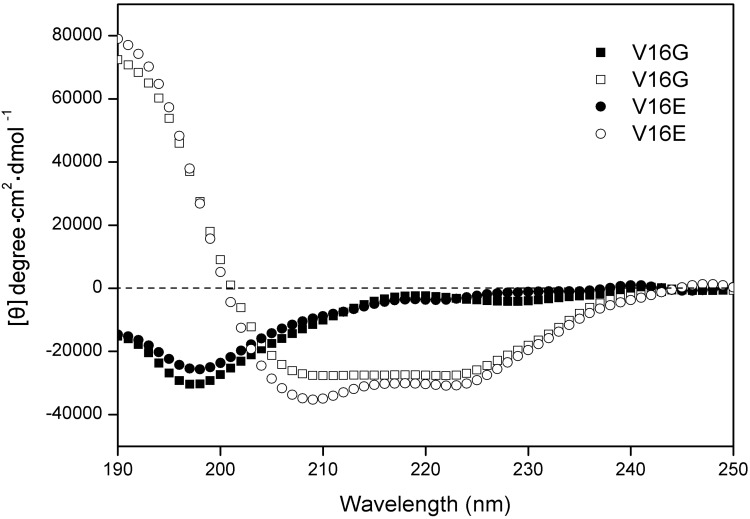
Figure 2.
CD spectra of peptide V16G and V16E at pH 7 and 25 °C in 50 mM KH2PO4/K2HPO4 containing 100 mM KCl. Solid symbols denote the CD spectra of peptide analogs in KP buffer without TFE, and open symbols denote CD spectra obtained in the presenceof 50% TFE. Peptide V16G data are presented by squares and V16E by circles.

