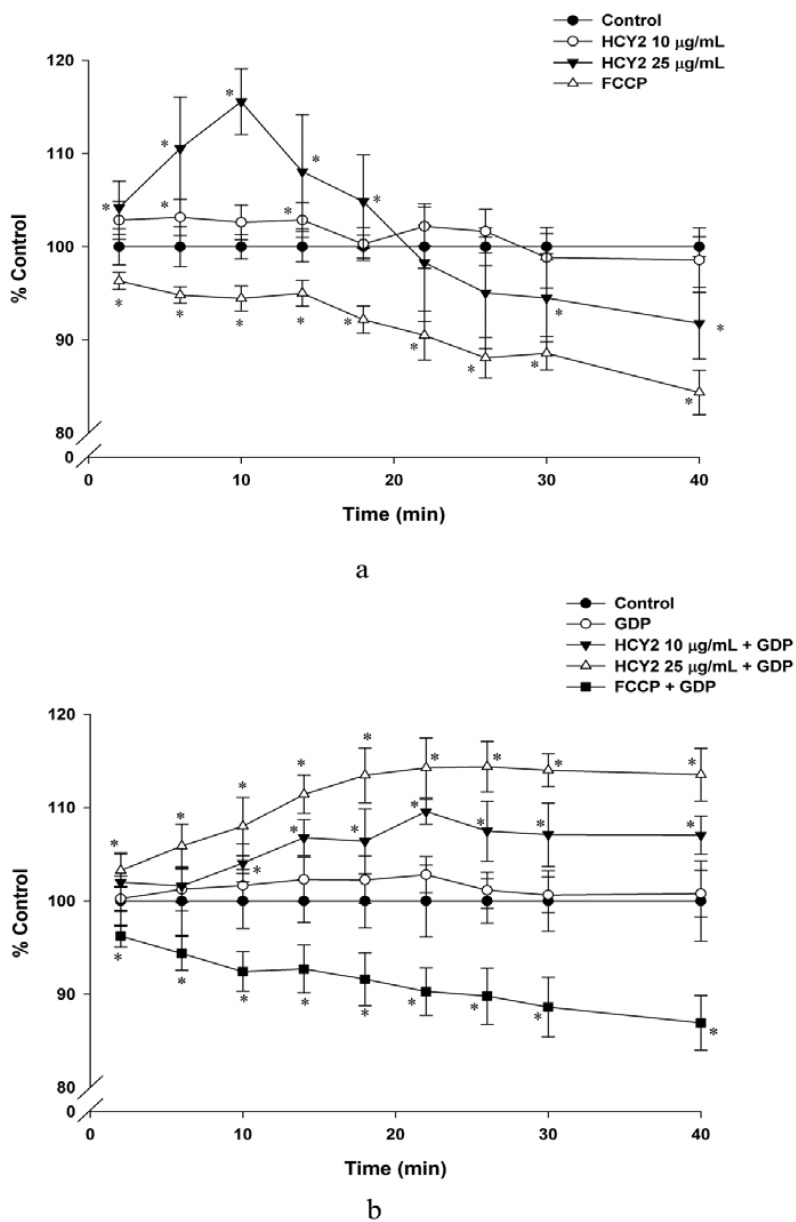
Figure 3.
Effects of HCY2 on mitochondrial membrane potential in H9c2 cells. Cells were incubated with HCY2 (10 or 25 µg/mL) without (a) or with (b) GDP (500 µM). FCCP (100 µM), a chemical uncoupler, was used as a positive control in this experiment. Mitochondrial membrane potential was measured as described in the Experimental Section. Data are expressed as percent control with respective to the time-matched non-herbal extract pre-incubated control. Values given are mean ± SD, with n = 3. * Significantly different from the control group without HCY2 pre-incubation (p < 0.05).

