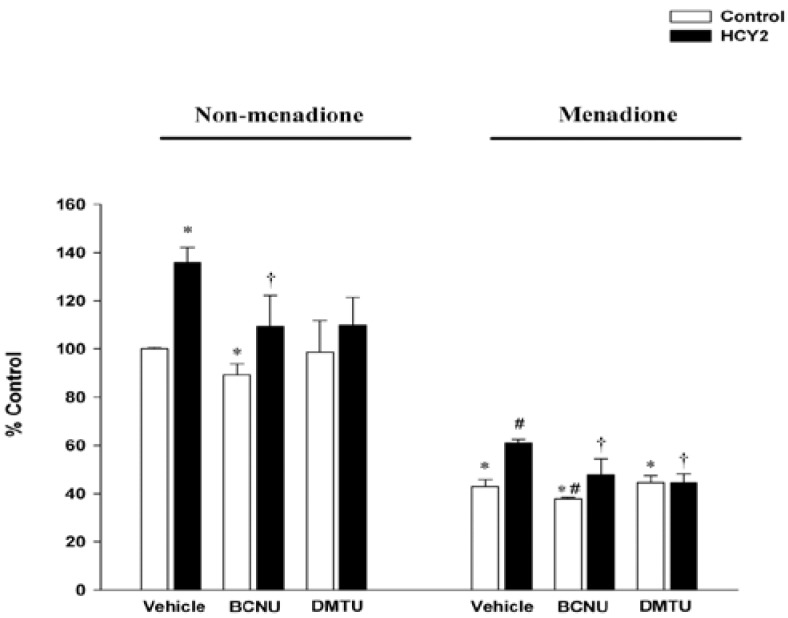
Figure 7.
Effects of HCY2 on cellular GSH levels in non-menadione and menadione-challenged H9c2 cells in the absence or presence of DMTU or BCNU. Cells were pre-incubated with HCY2 (25 µg/mL) in the absence or presence of DMTU (20 mM) or BCNU (50 µM) for 4 h, followed by another 4 h-incubation with or without menadione (12.5 µM). Cellular GSH levels were measured under non-menadione or menadione challenged conditions as described in the Experimental Section. Data are expressed as the percentage of non-menadione challenged control value (23.45 ± 0.16 nmol/mg protein). Values given are means ± SD, with n = 3. * Significantly different from the non-menadione challenged control group (p < 0.05); # significantly different from the menadione challenged control group (p < 0.05); † significantly different from the respective HCY2-pre-incubated group (p < 0.05)

