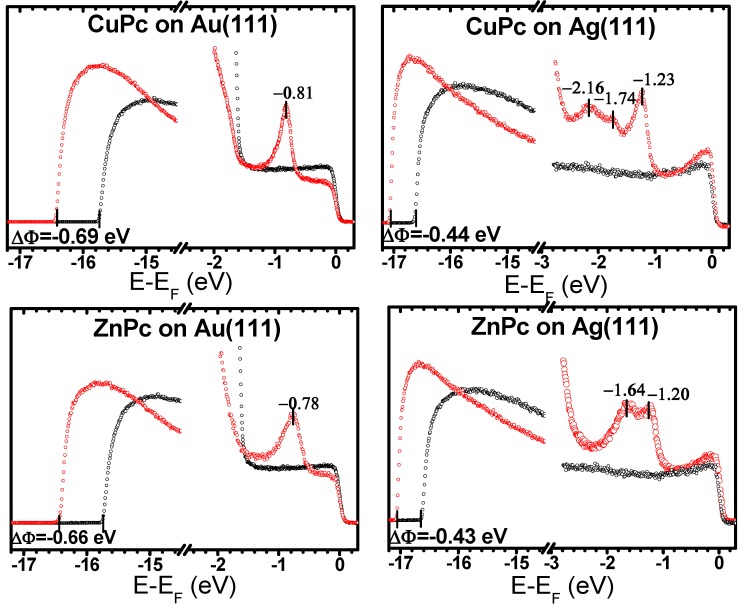
Figure 3.
UPS spectra of monolayer CuPc on (a) Au(111) and (b) Ag(111), and ZnPc on (c) Au(111) and (d) Ag(111). In each panel, the secondary cutoff spectra are displayed at the left side, while the valence region is shown at the right side. The black curves represent the clean substrate, and the red ones correspond to the monolayer Pc films after annealing at 250 °C (for details see Section 3.2).

