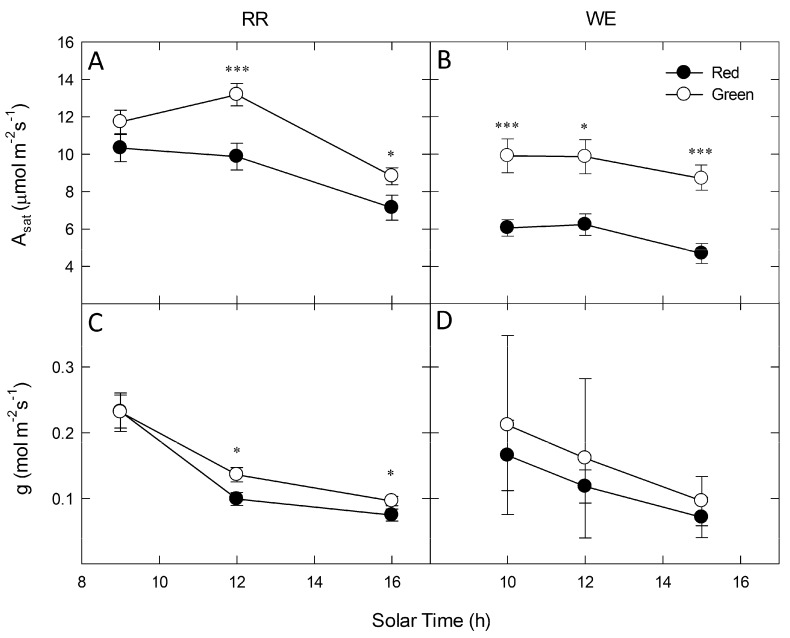
Figure 3.
Diurnal measurements of photosynthetic gas exchange for co-occurring red leaves (closed circles) and green leaves (open circles) under saturating red/blue LED irradiance. Panels (A) and (B) show photosynthesis at saturating irradiance (Asat) and (C) and (D) show stomatal conductance (g) at RR (left column) and WE (right column). Points represent means of 3–15 individuals of each color ± SE. Significant differences between red and green leaves at each time point denoted by asterisks (* p < 0.05; ** p < 0.01, *** p < 0.001).

