Fig. 1.
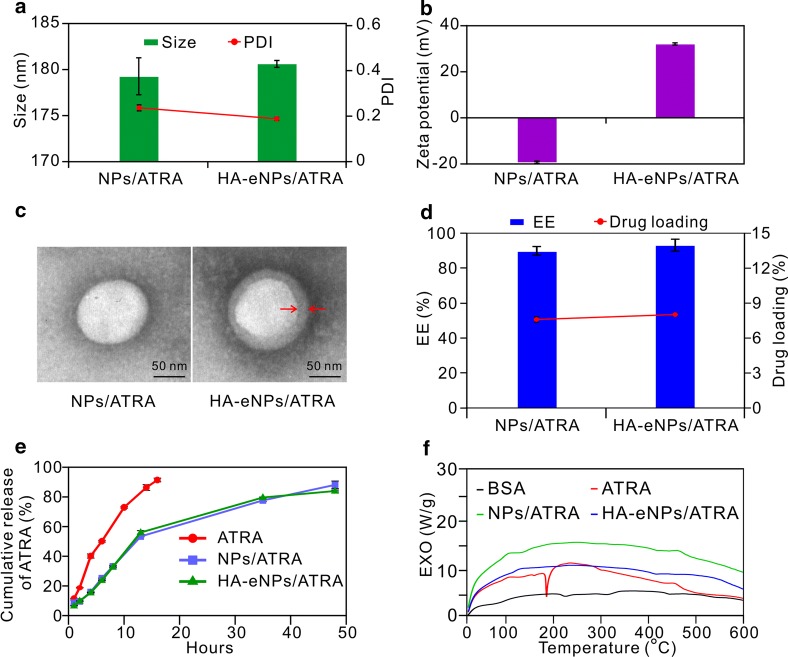
In vitro characteristics of NP formulations. a, b Diameter and zeta potential measurements of NP formulations. c Different nanoparticles visualized by transmission electron microscopy (TEM), scale bar: 50 nm (arrows indicate the coated HA layer). d The encapsulation efficiency and drug loading of NP formulations. Results are shown as the means ± SD (n = 3). e Release profiles of ATRA from NP formulations in PBS with 10% (v/v) ethanol. Results are shown as the means ± SD (n = 3). f Differential scanning calorimetry (DSC) thermograms of ATRA formulations

