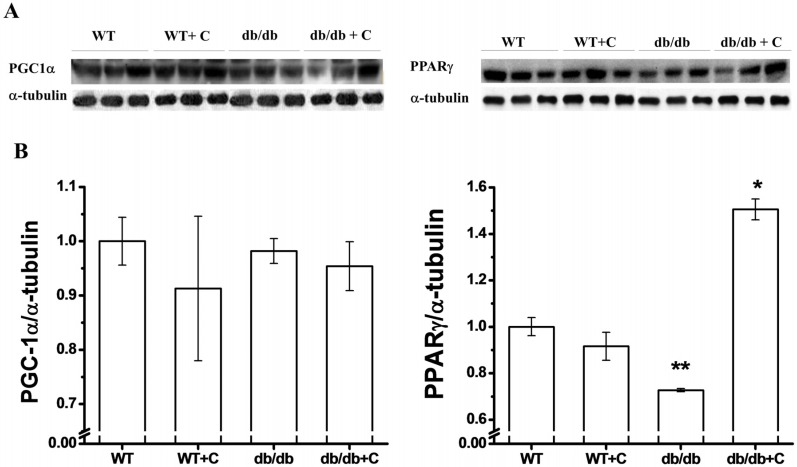
Figure 4.
Effect of curcumin on PGC-1α and PPARγ expression in liver. (A) Representative western blot of the PGC-1α and PPARγ expression; (B) Densitometry analysis of the PGC-1α/α-tubulin and PPARγ/α-tubulin ratios. Data are the means of n = 3 ± SEM. * vs. WT, WT+C and db/db, p < 0.001; ** vs. WT, p < 0.01.

