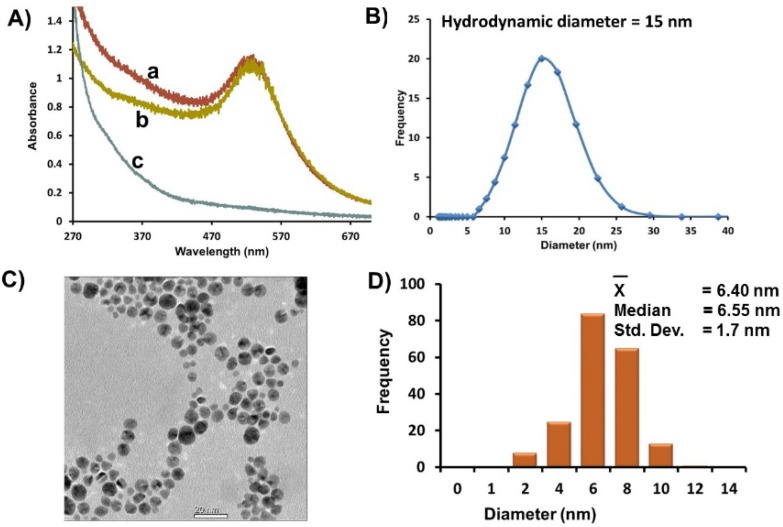
Figure 1.
(A) Representative UV-Vis spectra of Au-GSH (a) before purification, (b) after purification by ultracentrifugation, and (c) of a brown permeate solution containing smaller nanoparticles removed after ultracentrifugation. (B) Average hydrodynamic diameter based on DLS measurements of Au-GSH. (C) Representative TEM image. (D) Distribution histogram of Au-GSH (Scale bar = 20 nm). All samples were in 10 mM sodium phosphate buffer pH 8.0.

