Fig. 3.
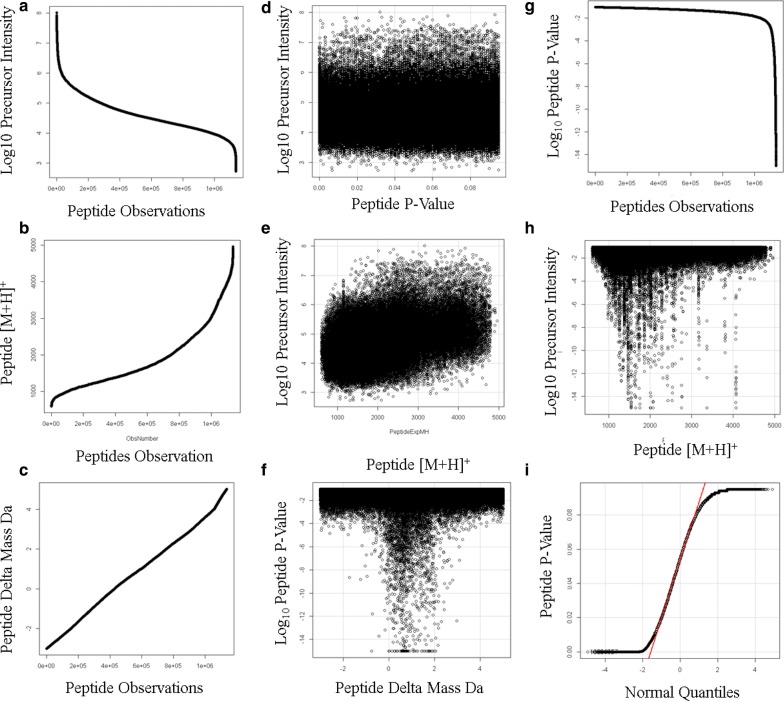
The distributions of the endogenous Rank 1 tryptic peptides correlated by the X!TANDEM algorithm from human EDTA plasma. a The sorted log10 precursor intensity values; b the sorted peptide [M + H]+ values; c the sorted peptide delta mass values; d the scatter plot log10 peptide p-values versus precursor intensity; e log10 intensity versus peptide [M + H]+ Residual standard error: 0.5488 on 1135580 degrees of freedom Multiple R-squared: 0.2236, Adjusted R-squared: 0.2236 F-statistic: 3.27e + 05 on 1 and 1,135,580 DF, p-value: < 2.2e−16); f log10 peptide p-values versus the delta mass value; G, sorted log10 peptide p-value; h log10 peptide p-value versus [M + H]+; i quantile plot of peptide p-values

