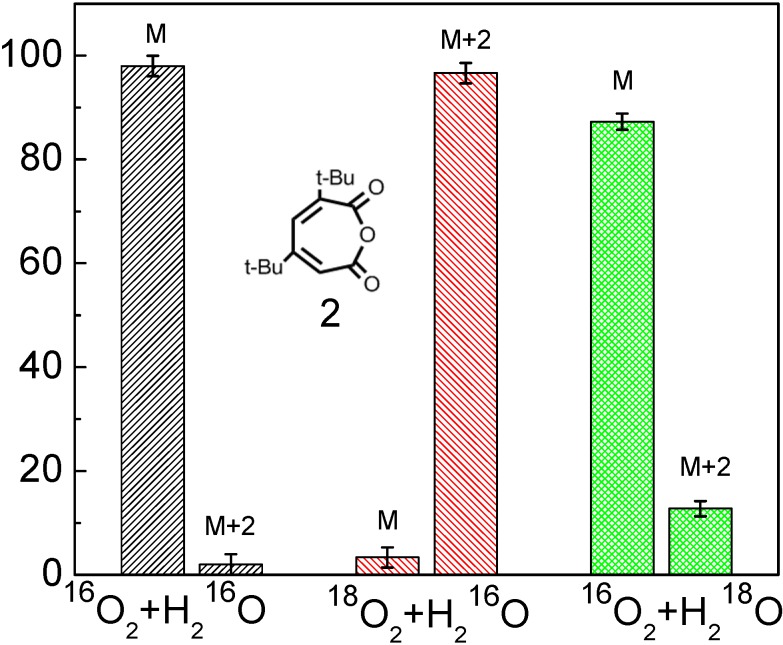
Figure 1.
The oxygen-isotope distribution of product 2 under the various isotope conditions. In each panel, the horizontal axis represents the three isotope conditions: (1) Natural 16O2 and H216O; (2) 18O2 and H216O; (3) 16O2 and H218O; the vertical axis represents the oxygen-isotope distribution ratio (%); M, M+2, M+4 denote products including 0, 1, 2 atoms of 18O in place of 16O [53].

