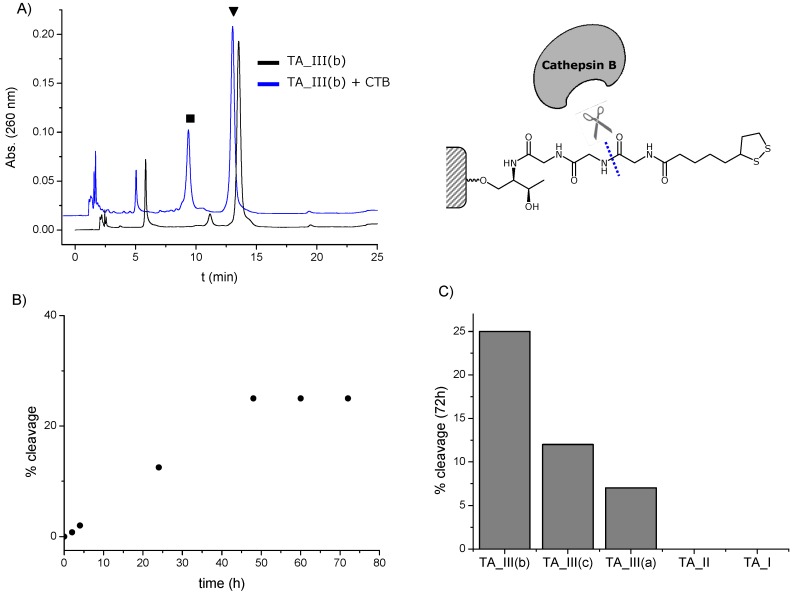
Figure 5.
(A) HPLC profiles obtained with TA_III(b) after 72 h in the presence (blue line) and in the absence (black line) of cathepsin B (CTB). ▼ stands for TA_III(b) and ■ stands for the product resulting from the amide-bond cleavage; (B) % amide-bond cleavage of TA_III(b) with time; (C) % amide-bond cleavage after 72 h of different TA-terminated oligonucleotides.

