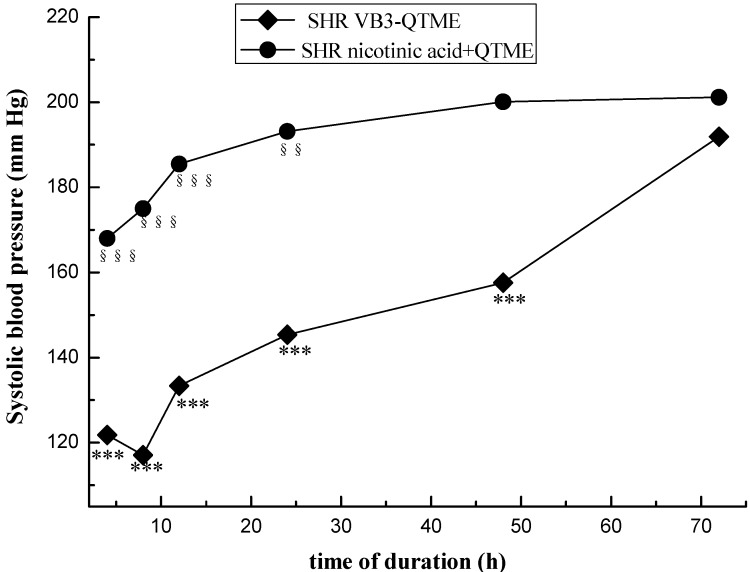
Figure 2.
Duration time after the 7 days’ VB3-QTME and nicotinic acid+QTME treatment in SHR. Each point represents the mean SBP in six rats. The data were given as means ± SEM. *** p < 0.001, between before treatment and after the 7 days’ treatment VB3-QTME; §§ p < 0.01, §§§ p < 0.001, between before treatment and after the 7 days’ treatment nicotinic acid+QTME.

