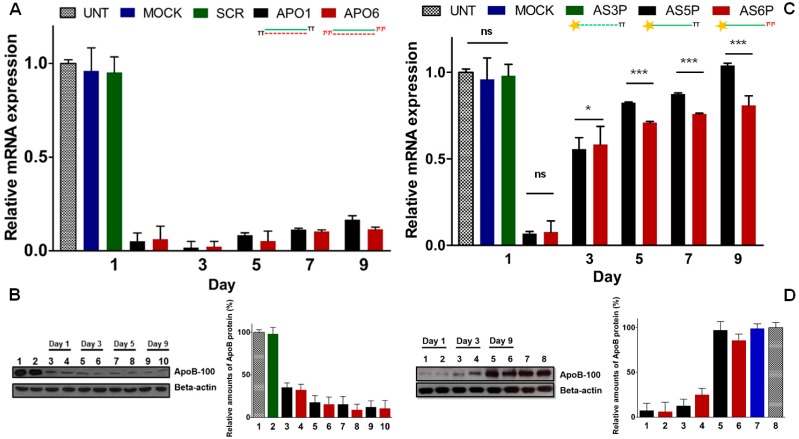
Figure 6.
Knockdown of the endogenous ApoB gene in HepG2 cells. (A) ApoB mRNA reduction with 60 nM of unmodified APO1 and modified APO6 ds-siRNAs; (B) Western blot and quantification plot of ApoB protein expression after siRNAs transfection. Lane 1: Untransfected; lane 2: Scrambled; lanes 3, 5, 7, 9: APO1 siRNAs; lanes 4, 6, 8, 10: APO6 siRNAs; (C) APOB mRNA levels with 60 nM of 5′-phosphorylated unmodified (AS5P) and modified (AS6P) single-stranded siRNAs; (D) Western blot and quantification plot of ApoB protein levels after treatment with ss-siRNAs (60 nM). Lanes 1, 3, 5: AS5P ss-siRNAs; lanes 2, 4, 6: AS6P ss-siRNAs; lane 7: Mock transfection; lane 8: Untransfected. n = 3 ± SD. ns = p > 0.05; * = p < 0.05; *** = p < 0.001. For quantification of ApoB protein levels, untransfected cells were set at 100%. Error bars indicate ± SD, n = 2. For experimental conditions see the Experimental Section.

