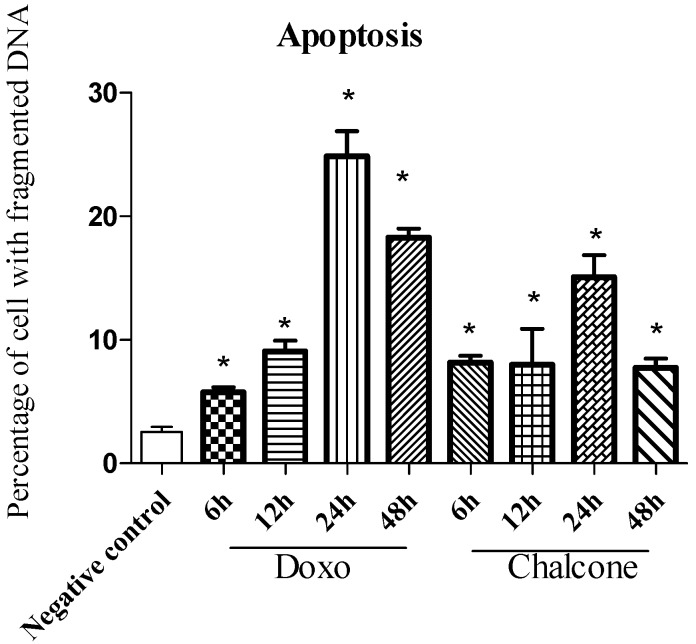
Figure 4.
Percentage of PC-3cells with fragmented DNA as assessed by Flow Cytometry, indicating the end of the apoptosis process induced by treatment with the isolated cardamonin. Values are the mean ± SD (n = 5). * = p < 0.05, ANOVA followed by the Tukey test, compared with the negative control—cells cultived with diluent for 48 h.

