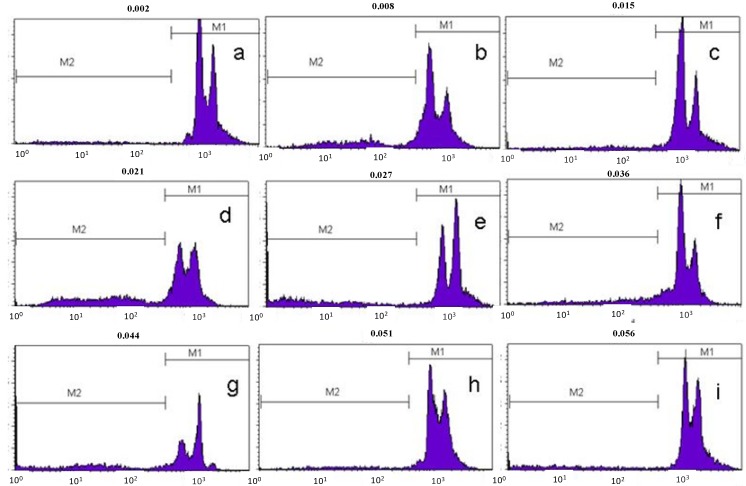
Figure 5.
Histogram representation of DNA fragmentation in PC-3 cells in flow cytometry. M1 region corresponds to cells with intact DNA and M2 region corresponds to cells with fragmented DNA: (a)—negative control, cells treated with diluent for 48 h; (b)—cells treated with doxorubicin for 48 h; (c)—cells treated with chalcone for 48 h; (d)—cells treated with doxorubicin for 24 h; (e)—cells treated with chalcone for 24 h; (f)—cells treated with doxorubicin for 12 h; (g)—cells treated with chalcone for 12 h; (h)—cells treated with doxorubicin for 6h; (i)—cells treated with chalcone for 6 h.

