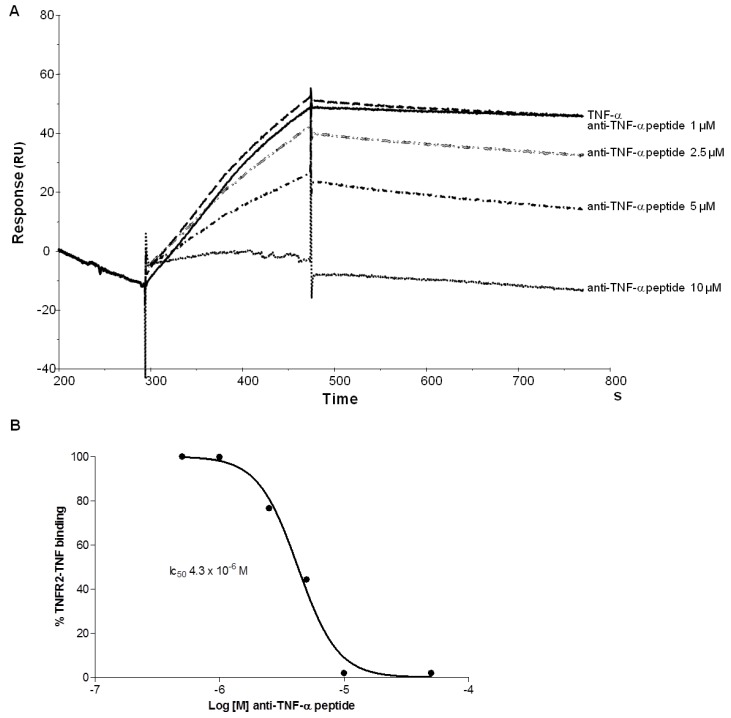
Figure 4.
Inhibition of TNF-α binding to TNFR2 analysed by SPR. A, Biacore sensorgrams illustrating binding of 3 nM hTNF-α to immobilized TNFR2, in the presence of different concentrations of branched peptide, from 10 µM to 1 µM. B, Curve of binding inhibition of hTNF-α to TNFR2 derived by experiment in A. y axis indicates the percentage of binding between TNFR2 and TNF-α; x axis represents the concentration of tetra-branched anti-TNF peptide. In B panel peptide concentrations of 500 nM and 50 µM are also reported. The IC50 is indicated.

