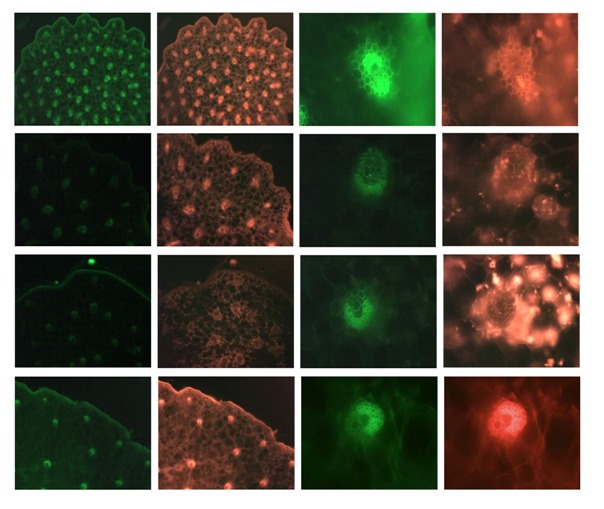
Table 6.
Comparison of key microscopic characters of four species of Dendrobium (under fluorescence microscopy).
| 40× * | 200× * | |||
|---|---|---|---|---|
| B-1 | G-1 | B-1 | G-1 | |
| D. officinale |  |
|||
| D. devonianum | ||||
| D. aphyllum | ||||
| D. gratiosissimum | ||||
| 500 µm | 100 µm | |||
B-1, emission filter of EF 450–500 nm; G-1, emission filter of EF 530–590 nm. * “×” stands for the amplification of the microscope.
