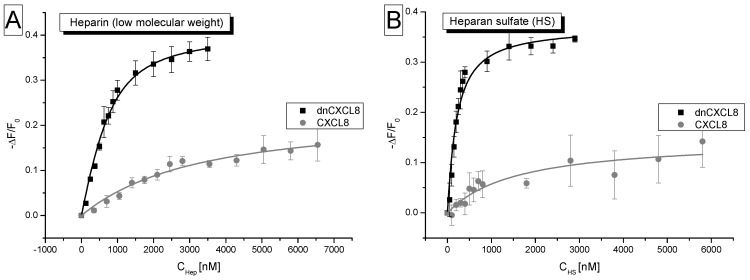
Figure 2.
Isothermal fluorescence titration: (A) heparin binding isotherms of CXCL8 and dnCXCL8; (B) HS binding isotherms of CXCL8 and dnCXCL8 (for Kd values see Table 1). On the y-axis, the relative change in fluorescence intensity following ligand addition is displayed: ΔF = F (fluorescence emission at a certain ligand concentration) − F0 (fluorescence emission in the absence of ligand).

