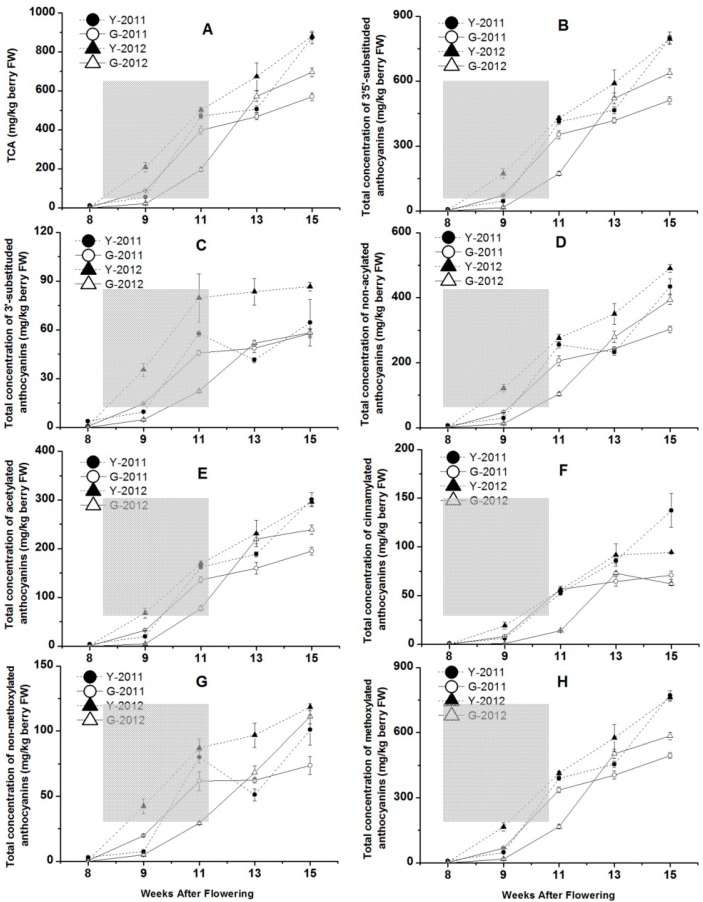
Figure 5.
The concentration of total anthocyanins, 3′5′-substituded and 3′-substituded anthocyanins, non-acylated, acetylated and cinnamylated anthocyanins, non-methoxylated and methoxylated anthocyanins changed with the grape development in two vineyards in 2011 and 2012. Data are mean values of three replications. Error bars show standard error (SE). Light grey background represents the phase of bunch turning colour (veraison) from 10% to 100% of coloured berries.

