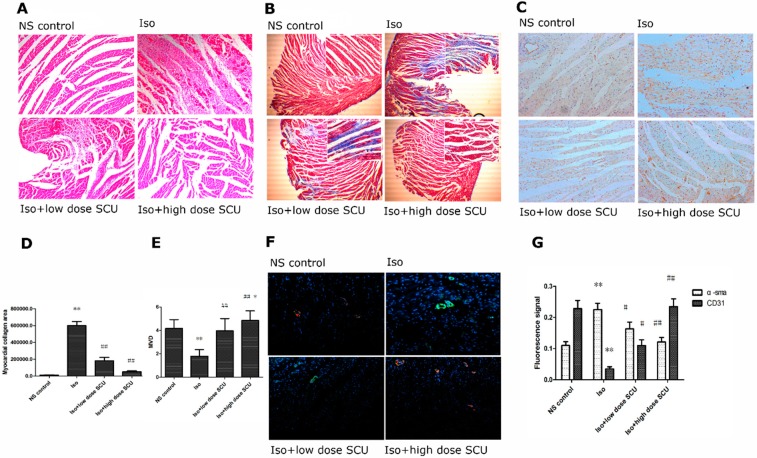
Figure 2.
(A) Haematoxylin and eosin staining of the left ventricular myocardium. Magnification ×200; (B,D) Myocardial collagen areas in the four groups. The cardiomyocytes were stained in red, fibrous tissues were stained in blue. Magnification ×40. Photomicrographs in the top right corner were taken at the magnification of ×200; (C,E) Effects of SCU on microvascular density (MVD) in Iso-induced myocardial fibrosis rat models. Magnification ×200; (F,G) Fluorescence signals of α-sma and CD31 in the four groups. Cells were immunostained with antibodies against α-sma (myofibroblastic phenotype; green) and CD31 (endothelial phenotype; red), and the nuclei were labelled using DAPI dihydrochloride (blue). Magnification ×200. * p < 0.05, ** p < 0.01 vs. control group; # p < 0.05, ## p < 0.01 vs. Iso group.

