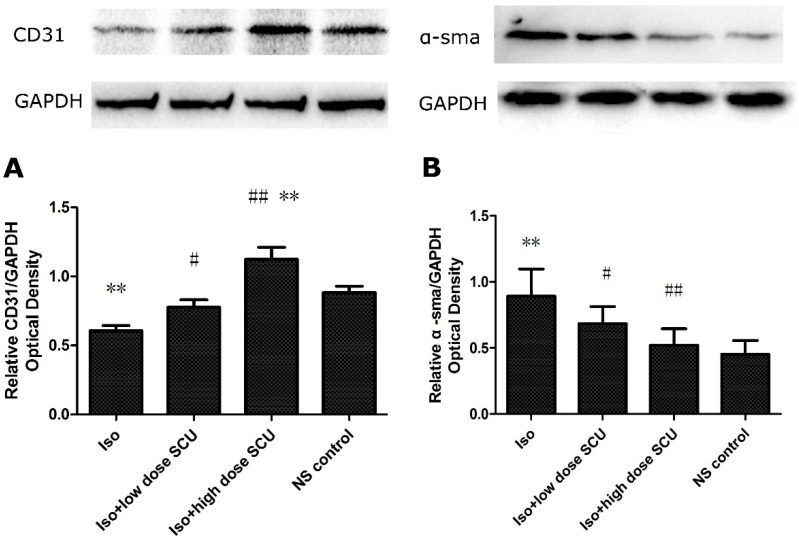
Figure 3.
Western blot analyses for CD31 and α-sma in the four groups. (A) The expression of CD31 protein ( ± s; n = 12); (B) The expression of α-sma protein ( ± s; n = 8).
** p < 0.01 vs. control group; # p < 0.05, ## p < 0.01 vs. Iso group. GAPDH, glyceraldehyde 3-phosphate dehydrogenase. Iso, isoprenaline; SCU, scutellarin.

