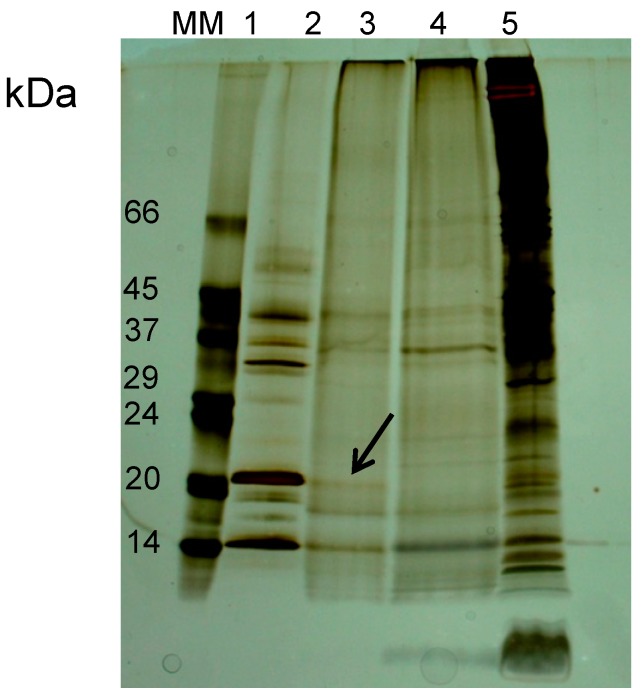
Figure 4.
NR-SDS-PAGE electrophoretic profile of Blad elution with 0.4 M galactose (lane 2) from erythrocyte membranes, and comparison with the pure Blad-containing oligomer (lane 1). Galactose elution from a control membrane with no previous protein incubation is presented (lane 3). The final membrane (lane 4) represents the electrophoretic profile remaining in the membrane after Blad elution. Molecular masses of standards (MM) are indicated in kDa. Arrow points to the polypeptide bound to erythrocyte membranes.

