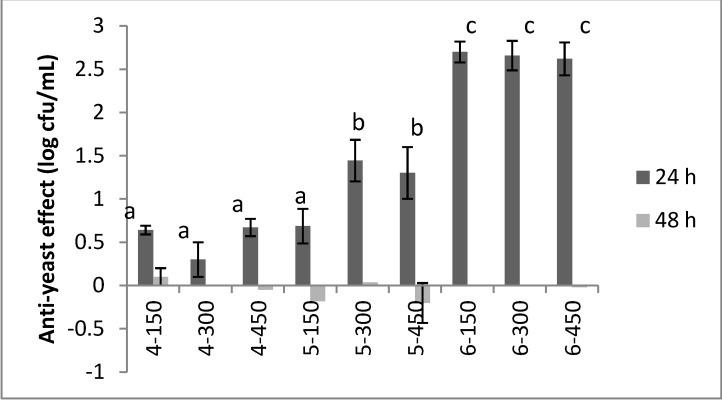
Figure 1.
Anti-yeast effect of the compounds 4–6 after 24 and 48 h. The results were reported as difference between the yeast count in the control C2 and the level of the target in the samples containing the antimicrobial compounds. Mean values ± standard deviation. The letters indicate significant differences (one-way ANOVA and Tukey’s test, P < 0.05). The number after the compounds indicate its concentration in the broth (150, 300 or 450 µg/mL).

