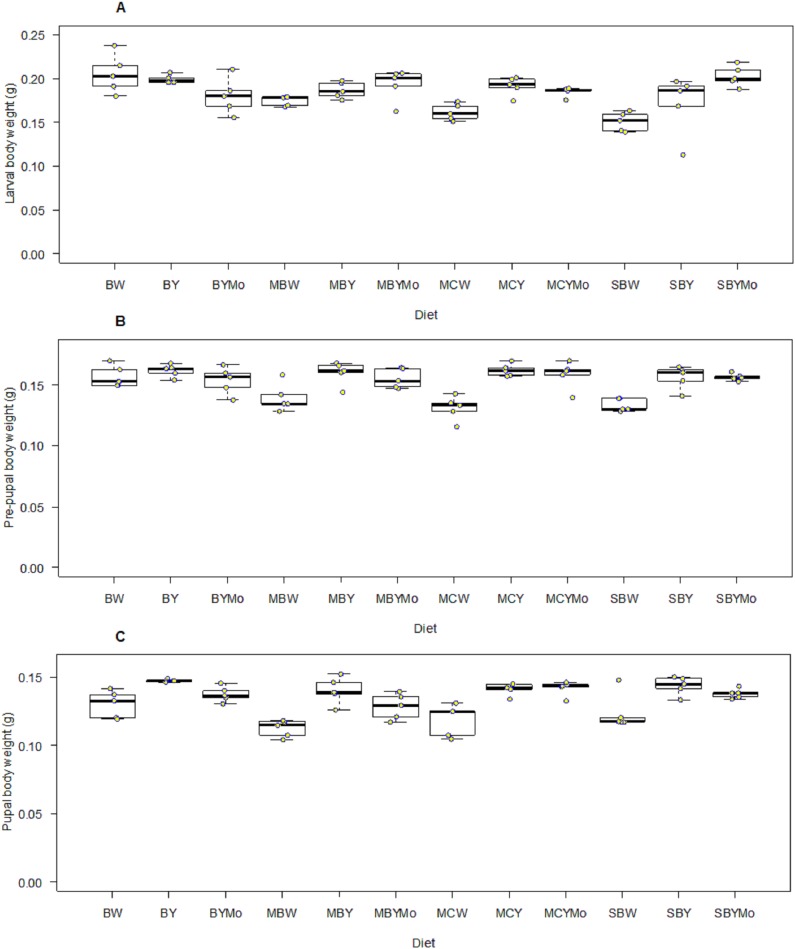
Figure 4. Boxplots showing wet weight (g) of larval (A), pre-pupal (B), and pupal (C) stages of H. illucens reared on different diet.
The middle quartile or median (the line that divides the box into two parts) marks the midpoint of the data. The middle box (inter-quartile range) represents 50% of the data for each diet. BW, Barley/water; MBW, Malt/Barley/water; MCW, Malt/Corn-starch/water; SBW, Sorghum/Barley/water; BY, Barley/brewer’s yeast; MBY, Malt/Barley/brewer’s yeast; MCY, Malt/Corn-starch/brewer’s yeast; SBY, Sorghum/Barley/brewer’s yeast; BYMo, Barley/brewer’s yeast/Molasses; MBYMo, Malt/Barley/brewer’s yeast/Molasses; MCYMo, Malt/Corn-starch/brewer’s yeast/Molasses and SBYMo, Sorghum/Barley/Molasses.

