
Figure 1.
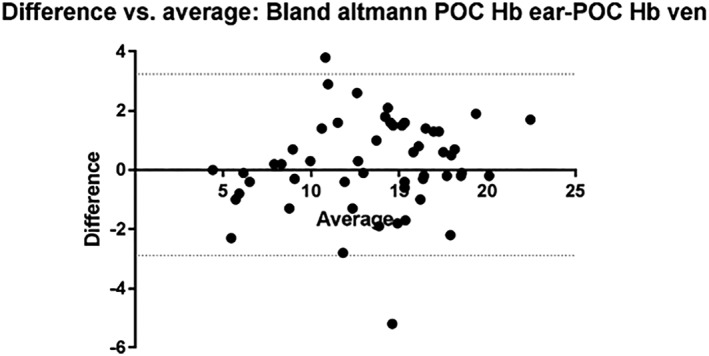
A Bland‐Altman plot comparing the average Hb concentration (g/dl) with the difference between the Hb concentration when measured using venous and peripheral blood
Official websites use .gov
A
.gov website belongs to an official
government organization in the United States.
Secure .gov websites use HTTPS
A lock (
) or https:// means you've safely
connected to the .gov website. Share sensitive
information only on official, secure websites.
A Bland‐Altman plot comparing the average Hb concentration (g/dl) with the difference between the Hb concentration when measured using venous and peripheral blood