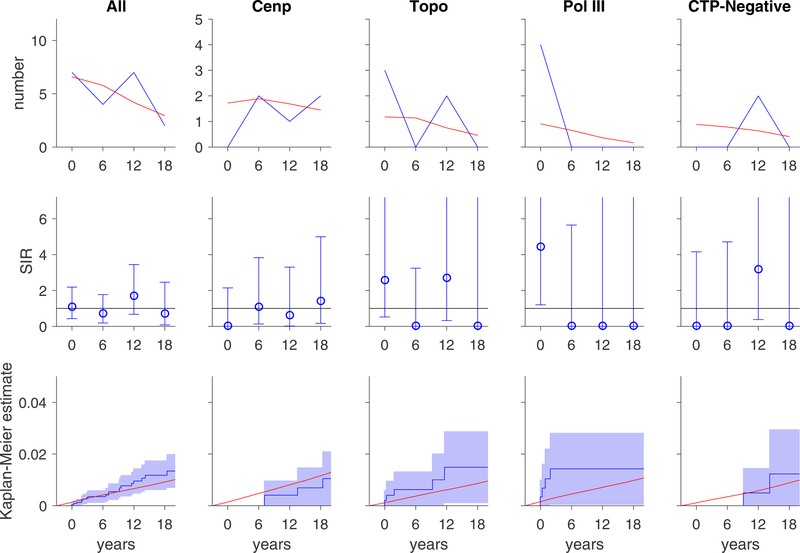
Figure 3. Risk of lung cancers over time.
In each graph, the x-axis reflects time from scleroderma onset (defined as time zero). Top and middle rows, each time window represents a 6-year period (±3 years); for example, data plotted at time zero reflects lung cancer risk within ±3 years of scleroderma onset. Top row, the observed number of lung cancer cases (blue) is presented in comparison with the number of lung cancer cases that are expected based on SEER data (red). Middle row, the ratio between the observed and expected lung cancer cases is presented as a standardized incidence ratio (SIR) along with its 95% confidence interval. Values of 1 denote a lung cancer risk equivalent to that of the background population. Bottom row, the cumulative incidence of lung cancer among scleroderma patients (solid blue line) starting at 3 years before scleroderma onset is presented with 95% confidence intervals (shaded blue region). Red lines represent the expected cumulative incidence of lung cancer based on SEER data for the general population. Scleroderma patients with pol III antibodies may have an increased risk of lung cancer at the time of scleroderma onset.

