
Figure 3.
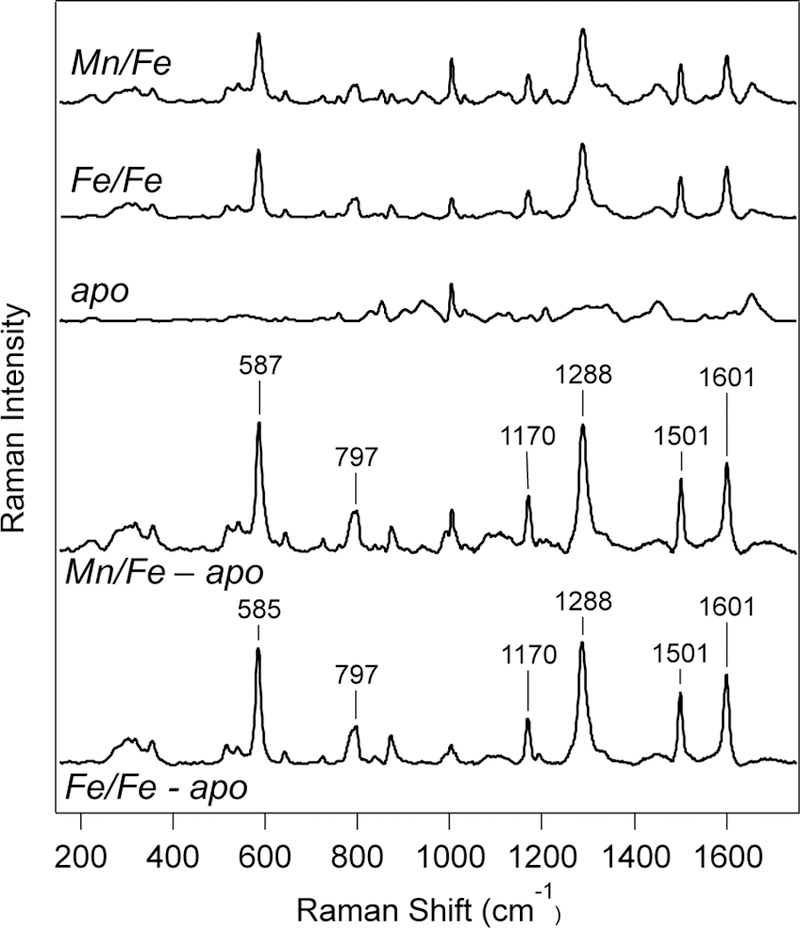
Resonance Raman spectra (λex = 457.9 nm; P = 20 mW; T = 298 K) of (top) photoconverted Mn/Fe, Fe/Fe, and apo-R2lox. (Bottom) Resonance Raman spectra of photoconverted Mn/Fe and Fe/Fe R2lox after subtraction of apo-R2lox spectrum to eliminate contributions from protein-derived bands.