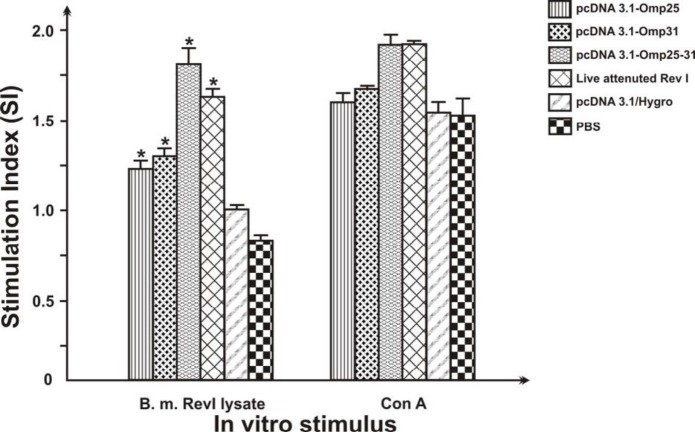
Figure 6.
Lymphocyte proliferation assay responses of spleen cells from immunized BALB/c mice with pcDNA3.1-Omp25-31, pcDNA3.1-Omp25, and pcDNA3.1-Omp31 DNA vaccines, native pcDNA3.1/Hygro, PBS, and Rev1 vaccine (five mice per group). Mice immunized with PBS were used as controls. Spleen cells from immunized mice were stimulated in vitro with Rev1 bacteria lysate and Con A. SI values show the lymphocyte proliferative activity for each group that were calculated as the ratio between the difference of mean absorption values at 570 nm of stimulated group (with antigen and Con A) of blank RPMI to the difference of unstimulated groups. Data represent the mean SI ± standard deviation from each six group. “*” significantly different compared with mice immunized with PBS (P< 0.01).

