
Figure 6.
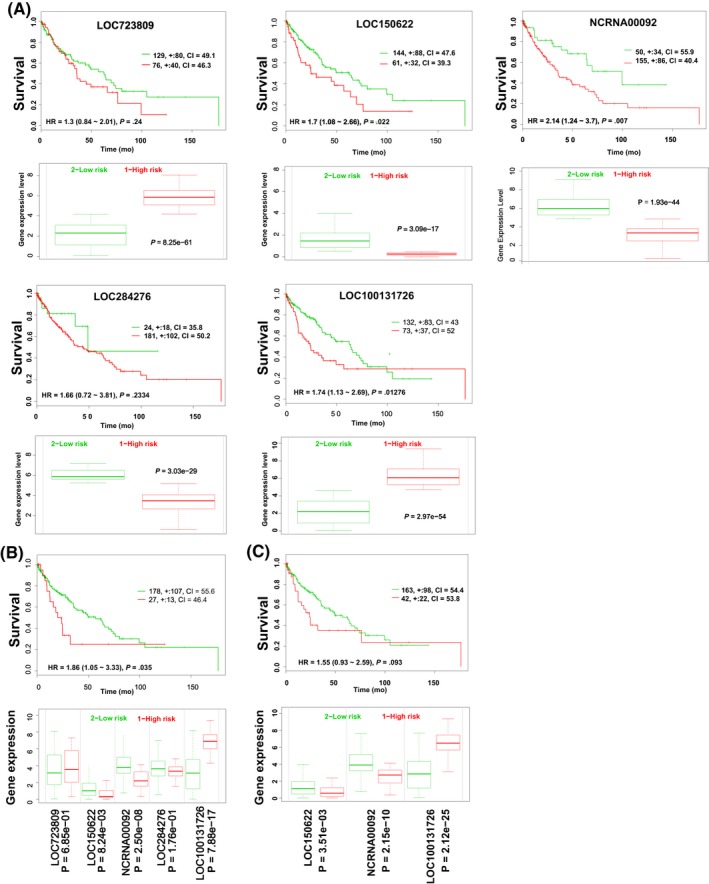
Relationship between long non‐coding RNAs (lncRNAs) and survival in lung squamous cell carcinoma. Upper panels: Kaplan‐Meier survival curves of lung squamous cell carcinoma patients. The patients were stratified by risk group based on each lncRNA (A), all 5 lncRNAs (B), and three lncRNAs (C) using the SurvExpress database. Lower panels: gene expression stratified by risk group using SurvExpress. Red lines, patients at high risk; green lines, patients at low risk. CI, confidence interval; HR, hazard ratio