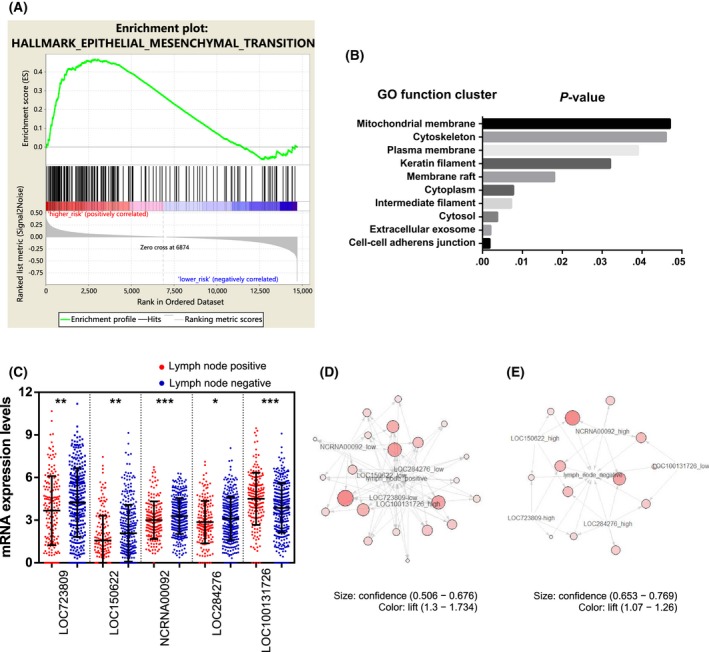
Figure 7.

Association between long non‐coding RNAs (lncRNAs) and tumor metastasis in lung adenocarcinoma patients. A, Gene set enrichment analysis enrichment score curves showing the relationship between the epithelial‐mesenchymal transition (EMT) pathway and the risk of lung adenocarcinoma (N = 255). Top panel: X‐axis indicates genes with high expression in the high‐risk (left end) and low‐risk (right end) patients. The green curve indicates the enrichment score. The positive enrichment score at the high‐risk end indicates upregulation of the EMT pathway in the high‐risk samples. Middle panel: black lines indicate genes expressed in the EMT pathway. Bottom panel: Gene list ordered by ranking metric. Positive value indicates correlation with high risk and negative value indicates correlation with low risk. B, Gene Ontology function cluster analysis of the genes coexpressed with these 5 lncRNAs. C, Expression profiles of these 5 lncRNAs in lymph node‐positive and lymph node‐negative lung adenocarcinoma patients. D,E, Connection between the expression of these 5 lncRNAs and a positive (red circles) (D) or negative (blue squares) (E) lymph node metastasis status. The lift value is shown by the color intensity and the size of the circle indicates the confidence value
