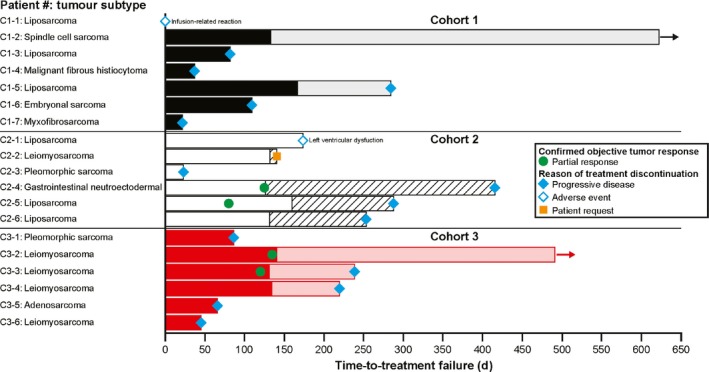
Figure 4.

Time‐to‐treatment failure. Coloring of bars before Cycle 6: Cohort 1 = black, Cohort 2 = white, Cohort 3 = red; coloring of bars from Cycle 7 onwards = Cohort 1 = grey, Cohort 2 = diagonal lines, Cohort 3 = light red. Arrows indicate ongoing treatment
