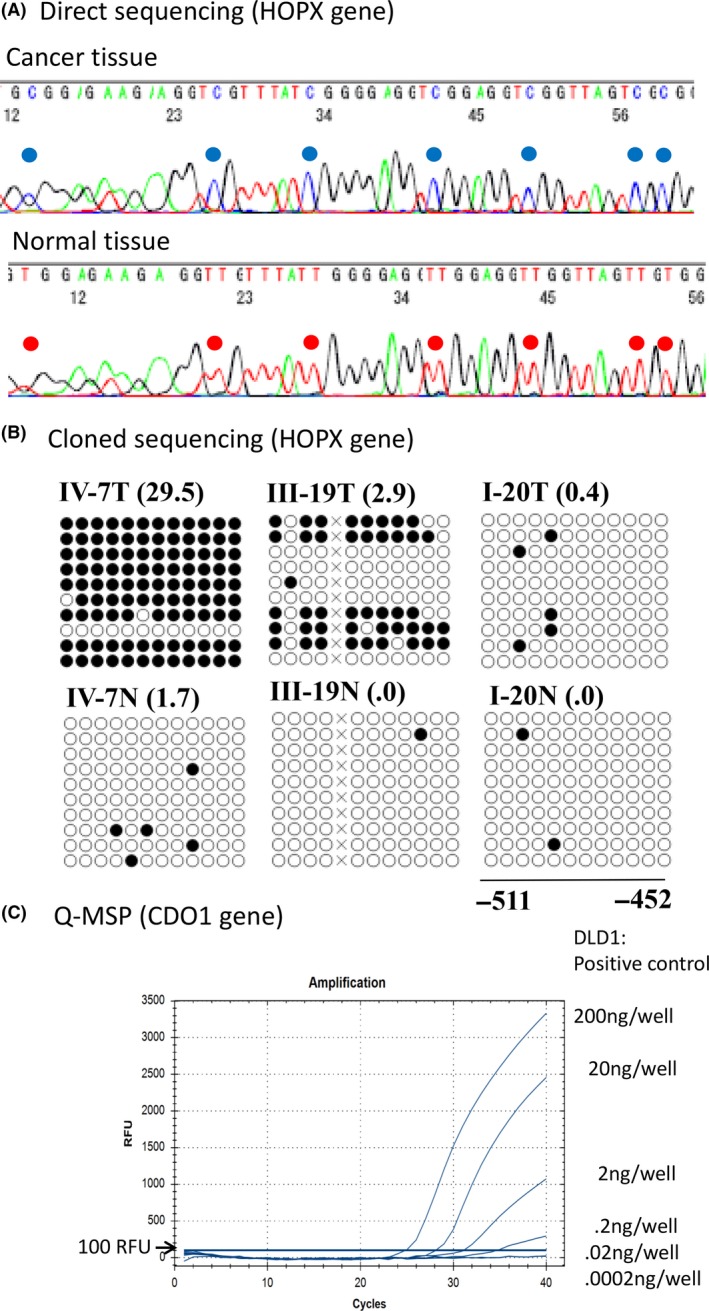
Figure 2.

A, Direct sequencing revealed cytosine methylation (at the blue location) in primary tumor tissues (upper panel), while no cytosine methylation was detected (at the red locations) in the corresponding normal tissues. These cytosine methylation sites were consistent with CpG islands in the promoter DNA of the HOPX gene. B, Cloned sequencing after PCR amplification of products revealed finer‐scale status of the methylated cytosines of the CpG portions of the HOPX gene promoter. Black circles represent methylated residues, while white circles indicate residues that lacked methylation (as assessed by cloned sequencing). TaqMeth values by Q‐MSP (HOPX value/beta‐actin value × 100) are indicated within parentheses (right corners of each panel). C, Q‐MSP for CDO1 gene methylation was performed in DLD1 cells, revealing almost full methylation (93.3% of the CpG sites were methylated as judged by cloned sequencing) at various dilutions. PCR amplification detected signals at dilutions of 10‐, 100‐ and 1000‐fold, but not at 10 000‐ and 100 000‐fold dilutions
