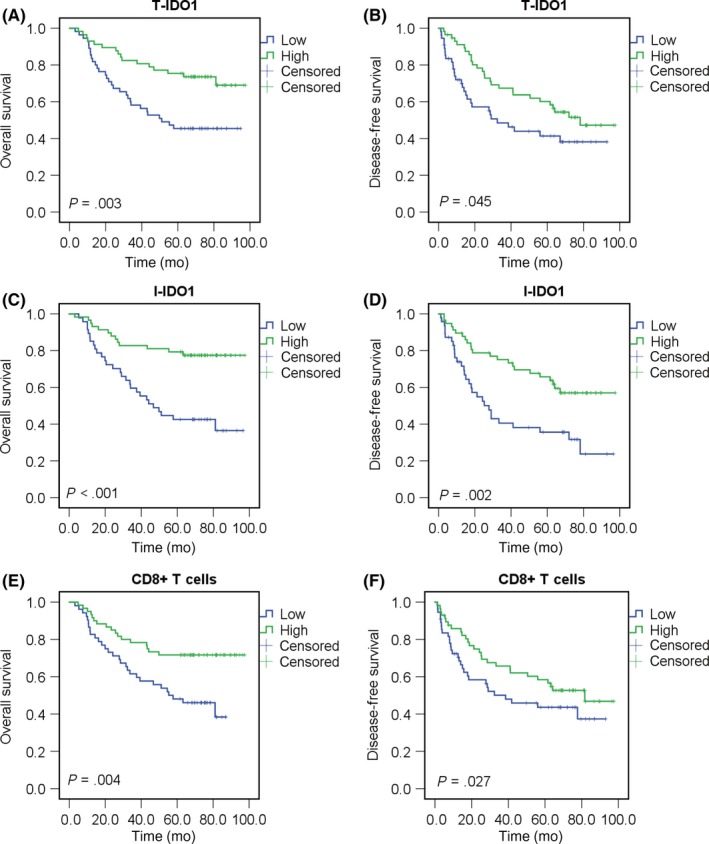
Figure 5.

Indoleamine 2,3‐dioxygenase 1 in T cells (T‐IDO1) and inflammatory cells (I‐IDO1) and CD8+ T cell densities correlated with superior overall survival (OS) and disease‐free survival (DFS) of hepatocellular carcinoma (HCC) patients. A,B, Kaplan‐Meier curves for the analysis of OS (A) and DFS (B) in HCC patients (T‐IDO1 low group, n = 55; T‐IDO1 high group, n = 57) according to T‐IDO1 protein levels. P values were calculated by the log‐rank test. C,D, Kaplan‐Meier curves for the analysis of OS (C) and DFS (D) in HCC patients (I‐IDO1 low group, n = 47; I‐IDO1 high group, n = 58) according to I‐IDO1 protein levels. E,F, Kaplan‐Meier curves for the analysis of OS (E) and DFS (F) in HCC patients (CD8 low group, n = 52; CD8 high group, n = 60) according to CD8+ T cell density. P values were calculated by the log‐rank test
